
- Title
-
Optogenetic Manipulation of Olfactory Responses in Transgenic Zebrafish: A Neurobiological and Behavioral Study
- Authors
- Jeong, Y.M., Choi, T.I., Hwang, K.S., Lee, J.S., Gerlai, R., Kim, C.H.
- Source
- Full text @ Int. J. Mol. Sci.

Generation of a transgenic zebrafish expressing ChR2-Kaede in olfactory sensory neurons. (A) Generation of transgenic fish using the expression construct of omp-driven ChR2-Kaede with transposase mRNA. (B) Schematic view of the transgenic zebrafish expressing channelrhodopsin-2 (ChR2) in olfactory sensory neurons. The green fluorescence of Kaede was photo-converted to red color, as an indicator for activation. (C,D) Ventral view of the head of the transgenic zebrafish embryos at 48 hpf and 72 hpf. (E,F) Dorsal view of the transgenic fish at 168 hpf. The Kaede protein of OSNs was photoconverted by UV light green to red fluorescence (F). Asterisks indicate the nasal pit, and arrows indicate the olfactory epithelium. m, mouth; OB, olfactory bulb. Scale bars, 50 μm. |

Expression analysis of c-fos for evaluating light-induced neuronal activity in transgenic fish. (A–D) Whole-mount in situ hybridization of c-fos in the transgenic fish and non-transgenic siblings at 5 dpf. (A) Control non-transgenic fish. (B) Light-irradiated non-transgenic fish. (C) Control transgenic fish. (D) Light-irradiated transgenic fish. Dotted boxes indicate olfactory epithelium of 5 dpf zebrafish. In light-irradiated transgenic fish, c-fos expression was ectopically induced at the olfactory epithelium (D). (E) Quantitative analysis of c-fos expression in olfactory epithelium. Intensity of c-fos transcripts in olfactory epithelium (dotted boxes) was measured by Image J. n = 4 for control sibling; n = 4 for control TG; n = 4 for light-irradiated sibling; and n = 5 for light-irradiated TG. (Tg light vs. Tg control, p = 0.0095; Tg light vs. sibling light, p = 0.04181). (F–H) Suppression of light-evoked odor response by GABA application in transgenic fish expressing ChR2 in the olfactory sensory neurons. (F) 7mM GABA treated control transgenic zebrafish at 5 dpf. (G) Optically stimulated transgenic zebrafish with GABA. (H) Light-irradiated transgenic zebrafish. Black arrow indicates olfactory epithelium and asterisk marked olfactory bulb. (I) Intensity of c-fos expression in olfactory epithelium upon GABA treatment. n = 5 for each experiment. (Tg light vs. Tg light + GABA, p = 0.005). All values are represented as mean ± S.E.M; * p < 0.05 and ** p < 0.005. p value was determined by unpaired t test. ns, not significant. Scale bars: 100 μm. |
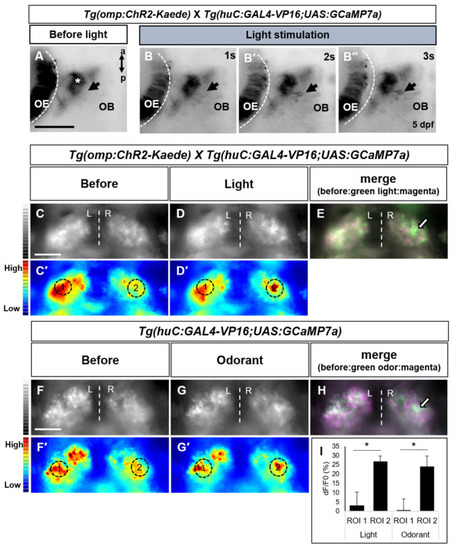
Analysis of calcium transient in olfactory bulb and habenula evoked light/odor stimuli. (A) Olfactory epithelium (OE) and olfactory bulb (OB) of transgenic fish before light irradiation. (B,B′,B″) After light stimulation, calcium signals were detected in olfactory bulb. Asterisk indicates axon terminals of olfactory sensory neurons and arrow indicates newly emerging cell bodies by optical stimulation. a, anterior; p posterior. Scale bar: 50 μm. (C–H) Odor responses of habenula in transgenic zebrafish lines. (C–D′) In Tg(omp:ChR2-Kaede);Tg(huc:GAL4-VP16;uas:GCaMP7a), habenular neuron responses to light. (F–G′) Odorant evoked habenular response in Tg(huc:GAL4-VP16;uas:GCaMP7a). Cells before stimulated were colored in magenta, and cells responding to light/odor were colored in green (E,H). Data are representative of at least two independent experiments. (I) Bar chart showing average dF/F0 of ROI 1 (left habenula) or ROI 2 (right habenula) in zebrafish brain expressing GCaMP7a upon the ChR2 driven light or odor activation (n = 3 each group). Dotted circles depict ROI of quantitative analysis. All values represent mean ± S.E.M. * p < 0.05. p value was determined by Student’s t test. L, left; R, right; ROI, region of interest. Scale bars: 50 μm. |

Light and odorant-driven behavior in transgenic zebrafish. (A) Schematic diagram of the conflicting sensory cues-based behavioral test. In a cross-shaped maze, blue light illumination and odorant treatment was performed. The light and the odor cue were both presented in the same (left) arm. (B–E) Images of zebrafish in the behavioral apparatus. The control sibling fish swam toward the blue light illuminated site (B), but when the light was co-presented with the aversive odor cue, they swam away from the stimulus presentation arm (C). The transgenic fish showed no avoidance behavior when the blue light and aversive odor were co-presented (E). Yellow arrows indicate the zebrafish larvae in the stimulus arm; white arrows depict the zebrafish in the no stimulus arm. (F–H) Behavioral response to blue light and aversive odor was measured by the percent of larvae counted in stimulus arm of the cross-shaped maze over time (20 fishes). (F) No sensory stimulus. (G) The aversive odor alone. (H) Blue light and aversive odor co-presented. Dotted lines indicate 50 % of the number of fish in the stimulus arm (chance level performance). All values represent mean ± S.E.M. * p < 0.05. p value was determined by Student’s t test. n = 3 clutches from three independent experiments. |