FIGURE SUMMARY
Title

Association between erythrocyte dynamics and vessel remodelling in developmental vascular networks

Authors
Zhou, Q., Perovic, T., Fechner, I., Edgar, L.T., Hoskins, P.R., Gerhardt, H., Krüger, T., Bernabeu, M.O.
Source
Full text @ J. R. Soc. Interface

Simulated RBC velocity and cell flux in the primitive vasculature of developing mouse retina. (a) A vascular plexus of postnatal day 5 (P5) mouse retina, with vessel lumen and collagen matrix sleeves labelled by ICAM2 (light green) and Col.IV (dark red), respectively. The insets show four regions of interest (ROI-1, ROI-2, ROI-3 and ROI-4) selected from the remodelling region of the plexus. The red line indicates the transitional border between the sprouting and remodelling regions as estimated by [40]. (b) Network diameter histogram showing the total length covered by vessel segments of given diameters. (c) Simulated RBC velocities and (e) RBC fluxes measured in vessel segments from all ROIs. The shaded areas in (c,e) highlight data from capillary vessels within diameter between 3 and 7 μm. (d,f) Comparison of simulated RBC velocities and fluxes against recent in vivo measurements by [41,42] from adult mouse retinal capillaries with the same diameter range (two-sided Mann–Whitney U test).

Association between RBC hypoperfusion and vessel regression in the developing retinal network. (a) Classification of vessels based on their ICAM2 and Col.IV signals (here demonstrating ROI-1 as in figure 1a). All vessels in the ROI are divided into three groups, i.e. lumenized, regression and stenosis. (b) A snapshot of the simulation of RBC flow in ROI-1. (c) Combined cell trajectories in ROI-1 throughout the simulation (over 0.49 s). (dg) Statistical test of time-average RBC flux for the mentioned three groups in ROI-1, ROI-2, ROI-3 and ROI-4, respectively. Two-sided Mann–Whitney U test is performed. The sample sizes for the three groups are n = 44, 6, 13 in (d); n = 16, 3, 4 in (e); n = 18, 4, 6 in (f); n = 19, 7, 4 in (g).

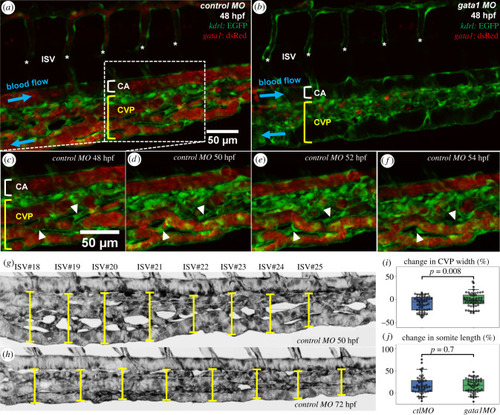
Time-lapse imaging of RBC perfusion and vascular remodelling in zebrafish caudal vein plexus. (a,b) Two exemplar caudal vein plexuses (CVPs, indicated by a square bracket in yellow) from a 48 hpf ctl MO embryo (with RBC perfusion) and a 48 hpf gata1 MO embryo (Tg(GATA-1:eGFP), without RBC perfusion). The intersegmental vessels (ISVs) are marked with asterisks, and the caudal artery (CA) is indicated by square bracket in white. The RBC precursors in (b) are located outside the vasculature and not circulating within the blood stream. (cf) Time sequence showing vessel regression events in a region of interest extracted from the ctl MO embryo in (a), where two vessel segments marked by white triangles are pruned over time (t = 48 hpf, 50 hpf, 52 hpf, 54 hpf). (g,h) Exemplar measurements of CVP widths (indicated by capped lines) at t = 50 hpf and t = 72 hpf along the anterior–posterior axis of a ctl MO embryo (Z-projection image) at positions given by eight consecutive ISVs (ISV 18–ISV 25). The lengths of corresponding somites (seven counted here for each fish) are estimated by the inter-ISV distances. (i) Normalized CVP width change and (j) normalized somite length change at t = 72 hpf against t = 50 hpf (relative change in percentages), calculated from measurements of the ctl MO group and the gata1 MO group (each containing 7 embryos). The statistical analysis in (i,j) is performed using Welch’s T test, with n = 56 in (i) and n = 49 in (j).

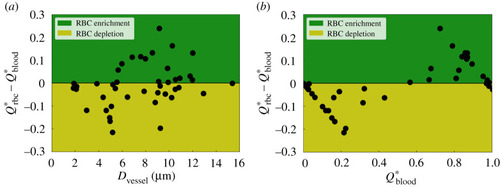
Quantification of RBC hypoperfusion in the developing retinal network. Qrbc and Qblood represent the normalized RBC flux and normalized blood flow in a given child vessel (with diameter Dvessel) relative to those in its parent vessel, respectively. The variable ΔQ=QrbcQblood serves as a disproportionality index of flow-mediated RBC partitioning, based on the sign of which the vessels are classified as ‘RBC-depletion’ (negative ΔQ*, yellow patch) and ‘RBC-enrichment’ (positive ΔQ*, green patch). The disproportionality indices for all investigated vessel segments are sorted against (a) vessel diameter Dvessel and (b) normalized blood flow Qblood. The analysed vessel segments in this plot are extracted from ROI-2, ROI-3 and ROI-4 (figure 1).

Comparison of simulation data with empirical predictions by the phase separation model [51]. (a) Simulation data of fractional RBC flux Qrbc against fractional blood flow Qblood in the relatively larger child branch ‘L’ (blue squares) and smaller child branch ‘S’ (red circles) from all investigated bifurcations. The inset shows similar results as in figure 4b (characterizing the disproportionality index ΔQ=QrbcQblood against Qblood), but with additional information of relative vessel size for child branches in each bifurcation. The black dotted line represents a linear hypothesis for Qrbc and Qblood in the absence of plasma skimming. (be) Four exemplar bifurcations in which the simulation data (squares and circles) agree well with empirical predictions (solid lines) for both the ‘L’ and ‘S’ child branches.

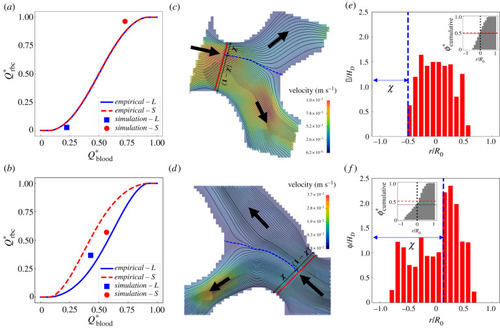
Occasional deviation of simulation data from the empirical model [51] due to the asymmetry of haematocrit profile in the parent branch. (a,b) Two exemplar divergent bifurcations for which the simulation data (square/circle symbols) deviate from PSM predictions (solid lines). (c,d) Visualization of the flow streamlines separated into the child branches on the mid-plane of the bifurcation (extracted from the 3D simulation). The blue dashed line indicates the location of the separation surface. (e,f) Cross-sectional haematocrit profile in the parent branch, at a position marked by the red solid line in (c,d). The blue dashed line corresponds to the separation surface of flow streamlines as in (c,d). The insets of (e,f) show the cumulative haematocrit distribution corresponding to the haematocrit profile.

Acknowledgments
This image is the copyrighted work of the attributed author or publisher, and ZFIN has permission only to display this image to its users. Additional permissions should be obtained from the applicable author or publisher of the image. Full text @ J. R. Soc. Interface