
- Title
-
Thyroid hormone regulates abrupt skin morphogenesis during zebrafish postembryonic development
- Authors
- Aman, A.J., Kim, M., Saunders, L.M., Parichy, D.M.
- Source
- Full text @ Dev. Biol.
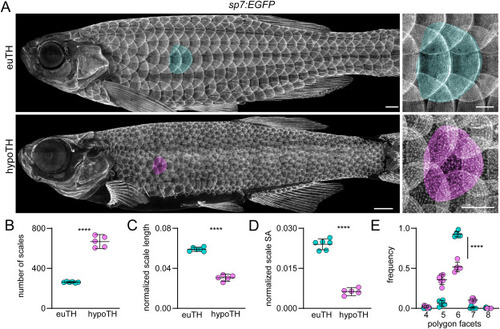
Thyroid hormone is necessary for normal squamation. (A) Dermal skeleton of eu-thyroid controls (euTH, n = 6) and hypothyroid (hypoTH, n = 5) fish visualized with sp7:EGFP. Representative scales false colored in green (euTH) and magenta (hypoTH). (B) hypoTH fish developed more numerous scales than euTH controls (t9 = 17.55, p < 0.0001). (C) hypoTH scales were shorter relative to fish body length, when scales were measured from their anterior to posterior margins and these lengths expressed as a proportion of the fish standard length (t9 = 19.22, p < 0.0001; n = 6 euTH, 5 hypoTH). (D) hypoTH scales occupied a significantly smaller portion of the body surface area (SA) compared with euTH controls (t9 = 17.58, p < 0.0001). (E) hypoTH squamation was disorderly compared to euTH controls, quantified by Voronoi tessellation analysis of pattern hexagonality. Each bin, 4–8, shows the proportion of scales bounded by that number of immediate neighbors. The frequency of scales bounded by the modal number of 6 neighbors in euTH animals vs other numbers of neighbors differed between euTH and hypoTH individuals (χ2 = 310.72, d.f. = 1, p < 0.0001, N = 396 scales of 6 euTH individuals and N = 1262 scales of 5 hypoTH individuals; ∗∗∗∗, t9 = 11.64, p < 0.0001). Proportions were arcsin-transformed for analysis (Sokal and Rohlf, 1981). Bars in plots are means ± 95% CI. Scale bars, (A) 1 mm. EXPRESSION / LABELING:
|
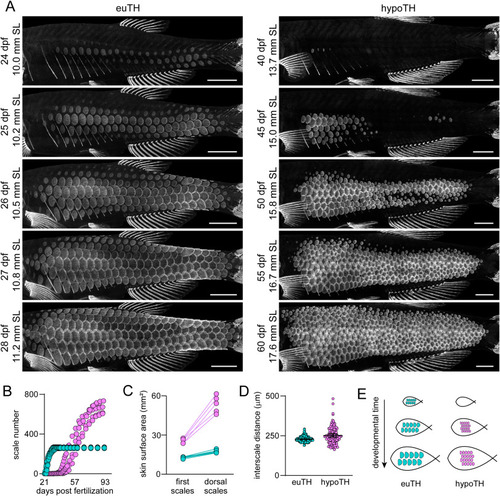
Thyroid hormone regulates squamation onset and progression. (A) Timeseries of sp7:EGFP expressing scales showing single representative euTH and hypoTH individuals (n = 6, n = 5, respectively). In the euTH individual, squamation spread to the dorsal midline in four days, while this process took 20 days in the absence of thyroid hormone. (B) The number of scales increased rapidly in euTH fish until reaching the adult complement. In hypoTH fish, scales were added over a long period of time, leading to more total scales than in euTH (n = 6 euTH, 5 hypoTH). (C) Body surface area expanded dramatically during the slow squamation of hypoTH fish (n = 6 euTH, 5 hypoTH). (D) The distances between anterior–posterior neighbor scales were slightly, but significantly greater in hypoTH fish relative to euTH (F1,13.3 = 8.0 p = 0.014; n = 10 measurements from each of 6 euTH and 5 hypoTH individuals with individual variation treated as a random effect in mixed model ANOVA; distances were ln-transformed for analysis to control for increased variability at larger distances). Bars, means ± 95% CI. (E) Cartoon showing how delayed squamation coupled with a nearly normal interscale distance leads to increased scale density in adults. Scale bars, (A) 1 mm. EXPRESSION / LABELING:
PHENOTYPE:
|
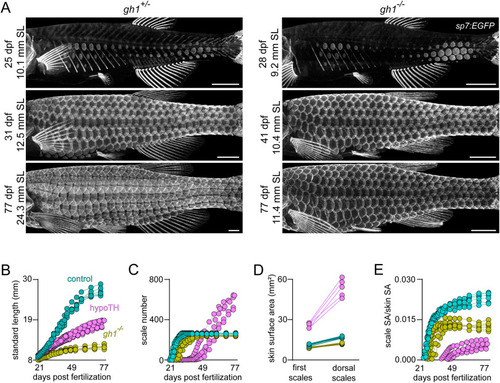
Normal patterning of squamation does not depend on body growth rate. (A) Mutants homozygous for a presumptive null allele of gh1 developed squamation similar to heterozygous siblings, visualized in sp7:EGFP transgenics in individual animals over time (n = 8 each genotype). (B) gh1 mutants grew more slowly than heterozygous siblings or hypoTH fish. (C) gh1 mutants added scales more slowly than heterozygous controls (n = 8, each condition), but more quickly than hypoTH animals (D). gh1 mutants had less body surface area expansion than heterozygous siblings (n = 8), or hypoTH individuals. (E) Scale surface area (SA), as a proportion total skin SA over time shows that gh1 mutants have a specific defect in allometric scale growth, despite normal squamation pattern. hypoTH data in C and D is replotted from Fig. 1 for reference. Scale bars, (A) 1 mm. EXPRESSION / LABELING:
PHENOTYPE:
|
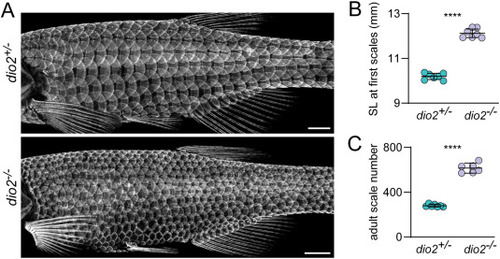
Dio2 is necessary for normal squamation pattern. (A) Loss of Dio2 function led to more numerous, smaller scales; similar to fish lacking thyroid glands. Visualized in sp7:EGFP transgenics (n = 7, each genotype). (B) Similar to thyroid-ablated tg:Venus-NTR hypoTH fish, dio2 mutants began developing scales later, at a significantly larger standard length (SL; t12 = 20.11, p < 0.0001; n = 7 each genotype). (C) Like thyroid-ablated hypoTH fish, change in timing and size at initiation of scale development was associated with an increased number of adult scales (t12 = 19.84, p < 0.0001). Bars in plots indicate means ± 95% CI. Scale bars, (A) 1 mm. EXPRESSION / LABELING:
PHENOTYPE:
|
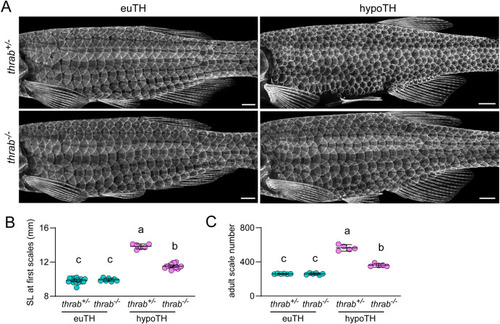
TH regulates squamation by relieving repressive activities of unliganded TRs. (A) Euthyroid (euTH) individuals homozygous for a presumptive null allele of thyroid hormone receptor gene thrab had an overtly normal pattern of squamation. Whereas hypoTH individuals heterozygous for the thrab mutation developed numerous, miniaturized scales, hypoTH animals homozygous mutant for thrab had a normal pattern of squamation. Visualized in sp7:EGFP transgenics (n ≥ 6 each genotype). (B) In euTH fish (n = 16 heterozygotes, n = 7 homozygous mutants), loss of thrab did not significantly affect standard length (SL) at squamation onset whereas in hypoTH fish (n = 6 heterozygotes, n = 16 homozygous mutants) loss of thrab led to a significant rescue towards the SL at squamation onset of euTH fish. Shared letters above groups indicate means that were not significantly different from one another (p > 0.05) in post hoc Tukey-Kramer comparisons (overall ANOVA, genotype x TH status interaction F1,41 = 183.4, p < 0.0001) (C) thrab mutation did not affect adult scale number in euTH fish (n = 6 each genotype), but consistent with the rescue of delayed squamation onset, thrab mutation significantly rescued adult scale number in hypoTH fish (n = 5 each genotype) towards wild-type levels. Scale bar, (A) 1 mm. EXPRESSION / LABELING:
PHENOTYPE:
|
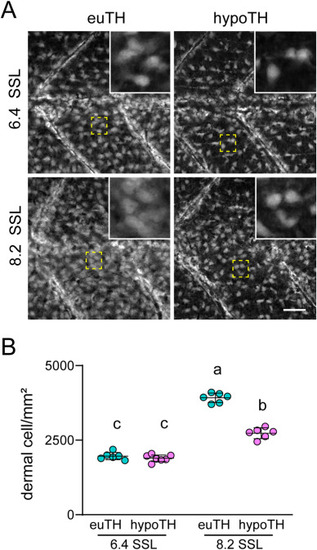
TH regulates densification of the primary hypodermis. (A) Primary hypodermal cells, visualized by imaging ET37:EGFP transgenic fish, have normal density in hypoTH individuals at 6.4 SSL. By 8.2 SSL, the primary hypodermis of hypoTH individuals appeared sparser than euTH controls. (B) Dermal cell density (cell/mm2) was similar in euTH and hypoTH fish at 6.4 SSL. By 8.2 mm SSL, euTH fish had significantly denser dermis than hypoTH siblings. Shared letters above groups indicate means not significantly different in post hoc Tukey Kramer comparisons (TH condition x stage interaction F1,10.4 = 109.1, p < 0.0001; mixed model ANOVA with individuals treated as random effect). Scale bar, (A) 100 μm. EXPRESSION / LABELING:
PHENOTYPE:
|
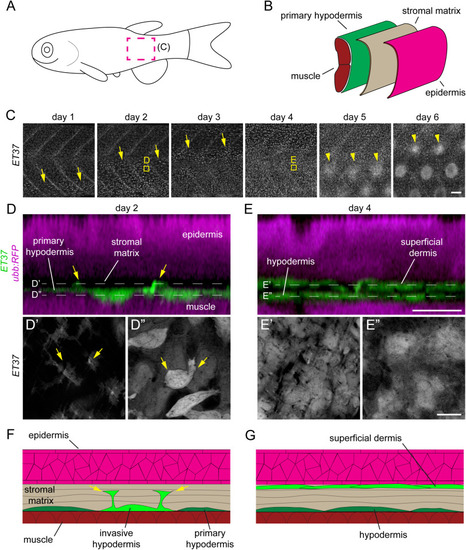
Postembryonic dermal morphogenesis involves superficial directed migration of primary hypodermal cells. (A) Schematic representation of a larval zebrafish with imaged region (C) marked by magenta dotted line. (B) Schematic coronal section of zebrafish trunk showing relative location of the primary hypodermis (green), collagenous stroma (beige) and epidermis (magenta). (C) Time series of late larval dermal morphogenesis visualized in ET37:EGFP; ubb:RFP transgenics. RFP channel omitted for clarity. On day 1 of imaging the first migratory dermal cells appeared near the ventral side of the skin as rounded cells with relatively intense ET37:EGFP expression (yellow arrows). Over the following three days, dermal migration swept dorsally and was completed by day 4. Scale papillae (yellow arrowheads) developed after dermal stratification had completed and followed a similar ventral–dorsal wave. Images are from a single representative individual (n = 8 fish total). (D,E) Super-resolution imaging of boxed regions in C, showing early (B) and completed (C) dermal stratification. Initially (day 2), the subset of primary hypodermal that express elevated ET37:EGFP extended (yellow arrows) toward the epidermis (labelled with ubb:RFP). Two days later (day 4) the dermis had been remodeled into a multilayer tissue. (F,G) Schematic representation of images in (D,E) showing early (F) and completed (G) dermal stratification. Thickness of collagenous stromal matrix is exaggerated for clarity. EXPRESSION / LABELING:
|

TH regulates dermal migration. (A) In-toto imaging of dermis in ET37:EGFP transgenics revealed a transition between a single-layered primary hypodermis to scaled skin over seven days [17–23 days post fertilization (dpf)]. Beginning at 17 dpf migratory dermal cells were apparent over the ribs (inset 1) but not above the anal fin (inset 2). A similar distribution was observed in hypoTH fish at 25 dpf. Dermal migration occurred in a wave that spread first posteriorly and then dorsally in both euTH and hypoTH fish, followed by scale papilla formation. Although the same qualitative sequence occurred in hypoTH individuals, it progressed more slowly. (B) Dermal migration was initiated in significantly older hypoTH fish compared with euTH controls (t19 = 9.19, p < 0.0001; n = 9 euTH, 12 hypoTH). (C) Owing to delayed initiation, body surface area was significantly larger in hypoTH fish at the onset of dermal migration relative to controls (t19 = 18.45, p < 0.0001). (D) Density of primary hypodermal cells at the onset of dermis migration was more variably and slightly increased in hypoTH fish compared with euTH controls t18 = 2.56, p = 0.02). (E) dSFCs differentiated in the superficial dermis in both euTH and hypoTH fish indicated by sp7:nucEOS expression (magenta). Bars in B–D, means ± 95% CI. Scale bars, (A) 500 μm for whole skin overviews or 100 μm for details, (E) 100 μm low magnification and 20 μm for details. EXPRESSION / LABELING:
PHENOTYPE:
|
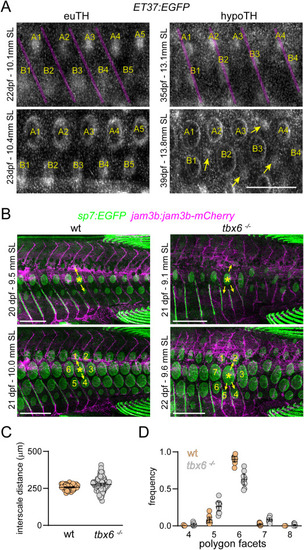
Normal squamation pattern is coupled to segmented myotomes. (A) In euTH control fish, scales (numbered by column and lettered by row) formed in the center of myotomes bounded by vertical myosepta (magenta overlay). In hypoTH individuals, initial scale papillae (numbered and lettered) developed closer to myosepta, and multiple scales formed above some myotomes (e.g., A1, A2, A3 over two myotomes). As patterning unfolded, new scale papillae (yellow arrows) appeared within the same rows as initial papillae, associated with increasingly disordered patterns. (B) tbx6 mutants, which mis-patterned vertical myosepta (labelled with jam3b:jam3b-mCherry), had disrupted patterns of squamation, visualized by sp7:EGFP. In both wild-type control animals and tbx6 mutants, myosepta predict the location of successive scale papillae (yellow arrows). In the mutant, an apparently branched myotome lead to incusion of an extra papilla which disrupted hexagonal patterning. (C) Anterior-posterior distances between early scale papillae were slightly increased and more variable in tbx6 mutants (effect of TH status, F1,9.3 = 6.7, p = 0.0289; mixed model ANOVA with individual fish treated as a random effect and distances ln-transformed for analysis to stabilize variance of residuals among groups; n = 10 measurements from 5 sibling controls and 8 mutants). (D) Voronoi tessellation analysis showed a significant reduction in pattern fidelity in tbx6 mutants relative to wild-type, as assessed by the incidence of scales bounded by the modal number 6 neighbors found in wild-type vs. numbers of neighbors other than 6 (χ2 = 110.7, d.f. = 1, p < 0.0001, N = 572 scales of 10 sibling controls and N = 551 scales of 10 tbx6 mutants). Bars in plots, means ± 95% CI. Scale bars, (A) 500 μm, (B) 1 mm. EXPRESSION / LABELING:
PHENOTYPE:
|

Finfold and pelvic fin morphometrics (A) Representative sequential images from sp7:EGFP timeseries showing disappearance of the larval fin-fold (orange arrows) in representative euTH and hypoTH individuals. Though fin fold resorption appeared similar morphologically between euTH and hypoTH, it was markedly delayed in hypoTH fish relative to age, SL [a proxy for stage (Parichy et al., 2009)], and pelvic fin outgrowth (orange bracket). Images are scaled to show similar anatomical region and highlight allometry in the growing fish. (B, C) Finfold resorption was delayed in hypoTH animals relative to euTH and completed in significantly larger and older individuals (t9=20.04, t9=21.98, both p<0.0001; n=6 euTH; n=5 hypoTH). (D) Pelvic fins grew more rapidly in euTH fish compared with hypoTH siblings. (E) Following a burst of allometric growth, the pelvic fins grew isometrically in both euTH and hypoTH individuals. Scale bars, (A) 1 mm. |

Eye growth was not affected by thyroid status. (A) Representative images from sp7:EGFP timeseries illustrating normal growth of the eye in hypoTH fish (orange dashed line), consistent with the observation that eyes are proportionally larger relative to body size in hypoTH fish compared to euTH at multiple stages of development (Hu et al., 2019). (B) Eye diameter increased at a similar rate in euTH and hypoTH fish (n=6 euTH; n=5 hypoTH). (C) Plot of eye diameter relative to standard length showing that the eye grew proportionally faster than the body in hypoTH fish compaed to euTH fish. Scale bar, (A) 1 mm. |

gh1 mutants are smaller than euTH and hypoTH individuals as they approach adulthood. sp7:EGFP expressing euTH control, hypoTH and gh1 mutants displayed to scale. The mutant is tiny yet had a normal pattern of squamation. Scale bar, 1 mm. |
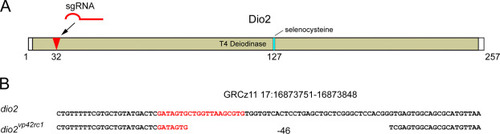
Generation of a dio2 mutant allele. (A) Diagram of Dio2 protein sequence showing location of sgRNA target site (red arrow) within the deiodinase domain. Numbers indicate amino acid position relative to start codon. (B) Genomic location and genetic lesion of the dio2 mutant, which leads to a frameshift followed by 6 novel amino acids and a premature stop codon. sgRNA target sequence indicated with red text. |

Expression TH pathway genes in skin during the period squamation. In-situ hybridization revealed transcripts for TH transporters (A), receptors (B) and co-receptors (C) in skin and scale papillae (one papilla is centered in each frame). (E) No-probe negative control; shha positive control. Scale bar, (in A for A–D) 200 μm. |
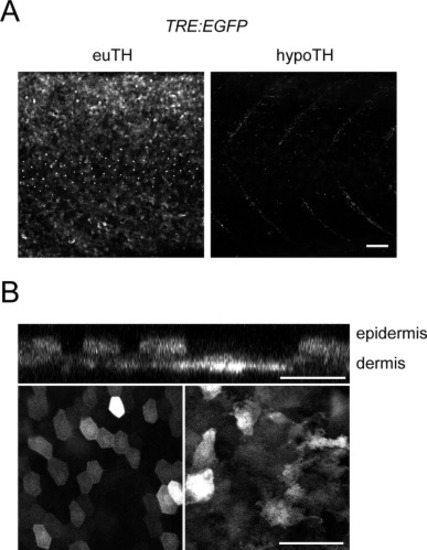
Expression of synthetic TH activity reporter in skin. (A)The synthetic TH reporter TRE-bglob:EGFP was broadly expressed in skin of euTH, but not hypoTH individuals (n=8 each condition). Weak fluorescence evident along the deeper horizontal myosepta in hypoTH represents TH independent expression of the reporter. (B) Higher magnification images showing reporter expression in superficial epidermis and deeper dermis in original planes of image capture (lower left and right, respectively) and in an orthogonal projection (above). All images were captured in 8.6 SSL larvae just prior to onset of squamation and before scales are overtly visible (Aman et al., 2018; Parichy et al., 2009). Scale bars, 100 μm. |
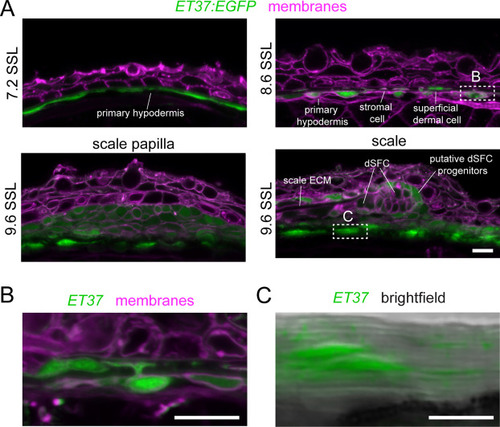
ET37:EGFP labels all dermal cells. Confocal images of vibratome sections through skin of ET37:EGFP transgenic larvae, counterstained with Cellbright membrane dye. (A) At 7.2 SSL, EGFP was expressed in a monolayer of cells beneath the epidermis, representing the primary hypodermis. At 8.6 SSL, the primary hypodermis was becoming a multilayered dermis. At 9.6 SSL, scale papillae and extending scales were present. ET37:EGFP was expressed in all papillar cells and in a subset of cells at the posterior margin of the scale. (B) Dermal cells labeled by ET37:EGFP included cells with projections extending from the cell body in a deep stratum of the developing dermis into a more superficial stratum towards the epidermis, as exemplified in this higher magnification image of the outlined region in A at 8.6 SSL. (C) ET37:EGFP+ cells beneath scales were embedded in a thick collagenous stroma, as revealed by contrasting horizontal lines associated with fibrillar collagen in merged brightfield and fluorescence channels of the boxed region in A at 9.6 SSL. Each image is representative of sections from at least four individuals. Scale bars, 100 μm. |
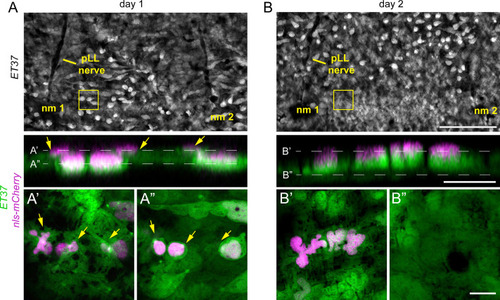
Nuclear translocation during dermal stratification. Repeated super-resolution imaging of dermal cells expressing a nuclear label (7xTCF-siam:nls-mCherry) revealed pre-migratory dermal cells (yellow arrows) that subsequently translocated into a superficial layer within 24 hours. (A) Gaps in the hypodermis that accommodate later line neuromasts (nm1 and nm2) and associated nerves (pLL nerve), enable repeated imaging of imaging the same anatomical location at high resolution (B). Scale bars, (A) 100 μm, (in C, for B and C), 10 μm. |

Dermal stratification followed a similar sequence of events in euTH and hypoTH individuals. Super-resolution imaging showing the appearance of ET37:EGFP pre-migratory cells (yellow arrows), followed by stratified dermis (green arrows) and scales (yellow arrowheads). Orthogonal projection (top) and maximum intensity projection (bottom). Scale bar, 25 μm. |
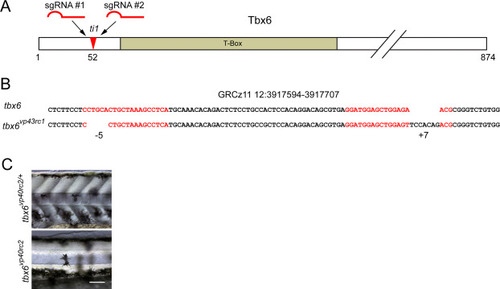
Generation of tbx6 mutant allele. (A) Diagram of Tbx6 protein sequence showing location of sgRNA target sites in relation to the T-Box DNA binding domain and the previously reported ti1 allele. (B) Genomic location and genetic lesion of the tbx6 mutant. sgRNA target sequences indicated with red text. (C) At two days post fertilization, tbx6 mutants displayed the classic fused-somites phenotype and lacked visible somites. Scale bar, 100 μm. |
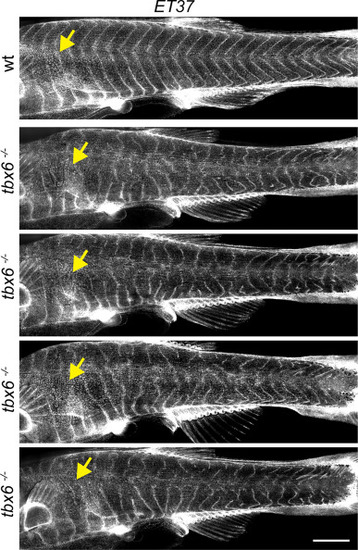
Segmentation in post-embryonic tbx6 mutants. At 8.6 SSL, dermal cells were beginning to stratify (yellow arrows). ET37:EGFP expression in primary hypodermal cells that appeared to ensheathe myotomes showed regularly spaced vertical myosepta in wild-type tbx6 siblings. In mutants lacking somites during embryonic development, vertical myosepta were highly irregular. Shown are four representative examples of 12 fish. Scale bar, 1 mm. |
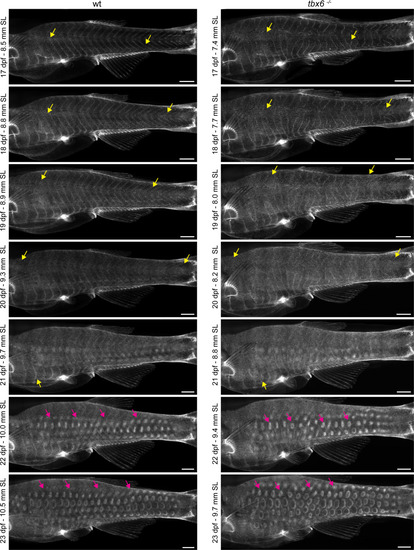
Dermal stratification in tbx6 mutants. Repeated in-toto imaging of ET37:EGFP revealed that dermis in tbx6 mutants stratified with patterning and timing like control animals. Yellow arrows indicate migrating primary dermal cells. Magenta arrows indicate developing scale papillae. Scale bars, 500 μm. |
Reprinted from Developmental Biology, 477, Aman, A.J., Kim, M., Saunders, L.M., Parichy, D.M., Thyroid hormone regulates abrupt skin morphogenesis during zebrafish postembryonic development, 205-218, Copyright (2021) with permission from Elsevier. Full text @ Dev. Biol.