FIGURE SUMMARY
Title

Effects of Natural Monoamine Oxidase Inhibitors on Anxiety-Like Behavior in Zebrafish

Authors
Jaka, O., Iturria, I., van der Toorn, M., Hurtado de Mendoza, J., Latino, D.A.R.S., Alzualde, A., Peitsch, M.C., Hoeng, J., Koshibu, K.
Source
Full text @ Front Pharmacol

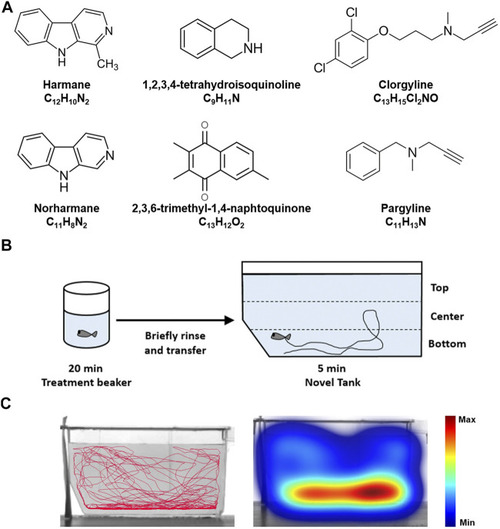
Zebrafish NTT experimental paradigm (A) The chemical structures of the test compounds–harmane, norharmane, TMN, TIQ, clorgyline, and pargyline–are shown (B) Zebrafish are placed in a treatment beaker with respective compounds for 20 min, briefly rinsed in system water, and then monitored in a novel tank for 5 min. The time spent at the top and bottom one third of the tank were then analyzed (C) A representative trace and heatmap of the swimming activity is presented for a vehicle control. The heatmap shows the minimum (dark blue) to maximum (dark red) amount of time a fish spent in each pixel. Abbreviations: NTT = novel tank test.

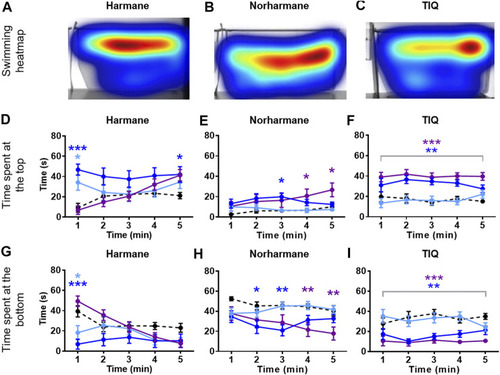
NTT results for harmane, norharmane, and TIQ. Representative heatmaps for (A) harmane (3 mg/L) (B) norharmane (3 mg/L), and (C) TIQ (100 mg/L) during the NTT for one zebrafish per compound are shown. The heatmaps show the minimum (dark blue) to maximum (dark red) amount of time a fish spent in each pixel. Time spent at the top and the bottom of the tank are quantified for (D and G) harmane (1, 3, and 10 mg/L), (E and H) norharmane (0.3, 1, and 3 mg/L), and (F and I) TIQ (10, 30, and 100 mg/L). All compounds show anxiolytic-like effects at at least one of the concentrations and time point. Black dashed line = vehicle control; light blue = lowest concentration; blue = middle concentration; purple = highest concentration. The sample size was 12 except for 10 mg/L harmane, control group for norharmane, 3 mg/L norharmane, and 100 mg/L TIQ, which were n = 11. Data are expressed as mean ± SEM. *p < 0.05; **p < 0.01; ***p < 0.001; Abbreviations: NTT = novel tank test; TIQ = 1.2,3,4-tetrahydroisoquinoline.

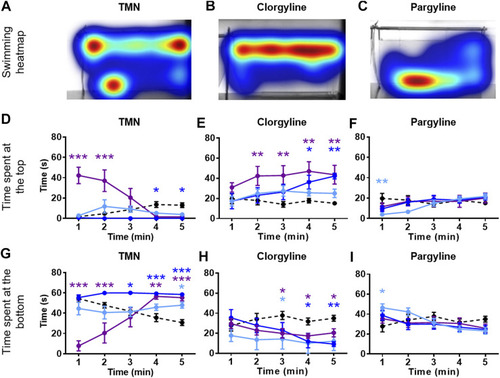
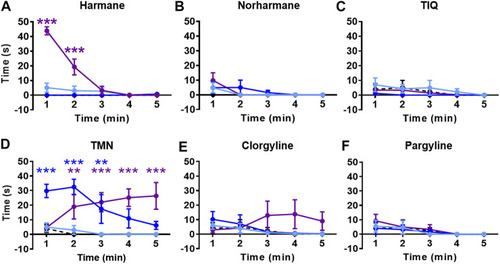
NTT results for TMN, clorgyline, and pargyline. Representative heatmaps for (A) TMN (30 mg/L) (B) clorgyline (100 mg/L), and (C) pargyline (10 mg/L) during the NTT for one zebrafish per compound are shown. The heatmaps show the minimum (dark blue) to maximum (dark red) amount of time a fish spent in each pixel. Time spent at the top and the bottom of the tank are quantified for (D and G) TMN (3, 10, and 30 mg/L), (E and H) clorgyline (10, 30, and 100 mg/L), and (F and I) pargyline (10, 30, and 100 mg/L). All compounds show anxiolytic-like effects at at least one of the concentrations and time point. Black dashed line = vehicle control; light blue = lowest concentration; blue = middle concentration; purple = highest concentration. The sample size was 12 except for control group for TMN (n = 11), 3 mg/L TMN (n = 9), 10 mg/L and 30 mg/L TMN (n = 7), 30 mg/L Clorgyline (n = 8), and 100 mg/L Clorgyline (n = 6). Data are expressed as mean ± SEM. *p < 0.05; **p < 0.01; ***p < 0.001; Abbreviations: NTT = novel tank test; TMN = 2,3,6-trimethyl-1,4-naphthoquinone.

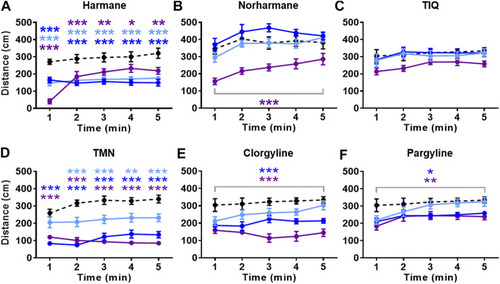
Effects of MAO inhibitors on total distance traveled. Total distance traveled during the NTT is presented for (A) harmane (1, 3, and 10 mg/L) (B) norharmane (0.3, 1, and 3 mg/L) (C) TIQ (10, 30, and 100 mg/L) (D) TMN (3, 10, and 30 mg/L) (E) clorgyline (10, 30, and 100 mg/L), and (F) pargyline (10, 30, and 100 mg/L). Black dashed line = vehicle control; light blue = lowest concentration; blue = middle concentration; purple = highest concentration. The sample size is detailed in the legends for Figures 3, 4. Data are expressed as mean ± SEM. *p < 0.05; **p < 0.01; ***p < 0.001. Abbreviations: NTT = novel tank test; TIQ = 1.2,3,4-tetrahydroisoquinoline; TMN = 2,3,6-trimethyl-1,4-naphthoquinone.

Effects of MAO inhibitors on freezing time. Total freezing time during the NTT is presented for (A) harmane (1, 3, and 10 mg/L) (B) norharmane (0.3, 1, and 3 mg/L) (C) TIQ (10, 30, and 100 mg/L) (D) TMN (3, 10, and 30 mg/L) (E) clorgyline (10, 30, and 100 mg/L), and (F) pargyline (10, 30, and 100 mg/L). Black dashed line = vehicle control; light blue = lowest concentration; blue = middle concentration; purple = highest concentration. The sample size is detailed in the legends for Figures 3, 4. Data are expressed as mean ± SEM. **p < 0.01; ***p < 0.001. Abbreviations: NTT = novel tank test; TIQ = 1.2,3,4-tetrahydroisoquinoline; TMN = 2,3,6-trimethyl-1,4-naphthoquinone.

Acknowledgments
This image is the copyrighted work of the attributed author or publisher, and ZFIN has permission only to display this image to its users. Additional permissions should be obtained from the applicable author or publisher of the image. Full text @ Front Pharmacol