Knowledge mining of Zhongjing formulae. A Word cloud of top 100 common diseases-related phrases in included literatures; B Flow chart of Word2Vec based knowledge mining analysis; C Ten Zhongjing formulae most closely related to gastrointestinal inflammatory diseases

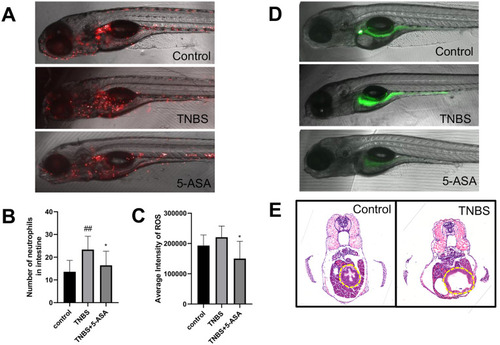
TNBS induced IBD phenotypes in zebrafish. A, B The intestinal distribution of red fluorescent-labeled neutrophils in control, TNBS and 5-ASA treated embryos; at least 6 embryos were examined for each group. C, D ROS staining (green signals) in control, TNBS and 5-ASA treated embryos; at least 5 embryos were examined for each group. E HE staining of embryo cross sections. The intestine regions were circled by yellow dotted lines. Scale bar: 100 μm. #compared with the control group; *compared with the model group; # or *, p < 0.05, ## or **, p < 0.01

Results of high-content screening of Zhongjing formulae fractions. A Scatter plot showing the effects of 74 formulae on intestinal neutrophils accumulation and ROS. B Heat map showing the rescue levels of 36 formulae with significant effects at at least one screening criterion. The formulae with dual effects in regulating both neutrophil number and ROS are marked with a red asterisk

Component analysis of effective fractions identified in the screen. A, B Base peak chromatogram of fraction A0206301B03 of Gegen Qinlian Decoction (A) and fraction A0221206A01 of Pulsatilla Decoction (B) obtained by UPLC-Q-TOF in positive ion mode. The name of chemical compounds identified with reference standards are labeled. C Comparison of main chemical compounds with reference standards

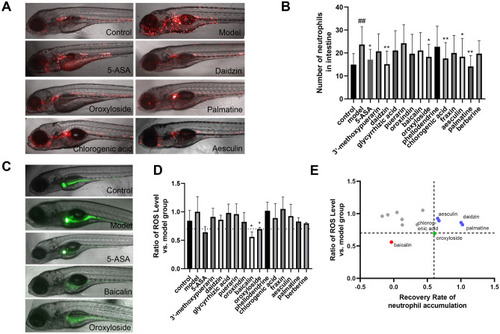
Results of high-content screening of Zhongjing formulae compounds. A, B Intestinal neutrophil accumulation in TNBS-stimulated embryos protected with different compounds; at least 10 embryos were examined for each group. C, D ROS level in embryos treated with different compounds; The dotted line in D marked the ratio of 0.7; at least 5 embryos were examined for each group. E Scatter plot summarized the effects of 13 compounds on intestinal neutrophils accumulation and ROS. Statistical comparisons were conducted between compound groups and model group. #compared with the control group; *compared with the model group; # or *, p < 0.05, ## or **, p < 0.01

The impacts of active compounds on the expression of inflammation and intestinal barrier markers. A, B Heat map and histograms summarizing the expression levels of proinflammatory factors and epithelial barrier related genes. C Representative HE staining images of embryo treated with different drugs. The intestine regions were circled by yellow dotted lines. Scale bar: 20 μm. #compared with the control group; *compared with the model group; # or *, p < 0.05, ## or **, p < 0.01

Acknowledgments
This image is the copyrighted work of the attributed author or publisher, and ZFIN has permission only to display this image to its users. Additional permissions should be obtained from the applicable author or publisher of the image. Full text @ Chin. Med.