FIGURE SUMMARY
Title

Macrophage morphological plasticity and migration is Rac signalling and MMP9 dependant

Authors
Travnickova, J., Nhim, S., Abdellaoui, N., Djouad, F., Nguyen-Chi, M., Parmeggiani, A., Kissa, K.
Source
Full text @ Sci. Rep.

Macrophages in the AGM can be divided into 4 morphological subgroups. (a) The drawing shows a 3D view of vessels and macrophages (red) imaged in (b). (b) 3D view of the AGM in the mid-trunk region of a Tg(kdrl:eGFP//mpeg1:mCherry-F) zebrafish embryo at 48 hpf showing the position of vessels (endothelium in green) and macrophages (in red, white arrows) in the outer side of the vein and in between the dorsal aorta and the cardinal vein. (c) 3D scatter plot showing the 3 attributes (circularity, roundness and elongation factor) used to divide macrophage to their shape categories; plot was generated in R using rgl package25. (d) Diagram of the decision chart for the 4 categories of macrophages delineated according to shape attributes. (e) Representative confocal images (maximum intensity projections) of individual categories with an outline drawing from particle analysis on the right. (f) Graph representing the percentage distribution of the different shape categories per AGM. Data are represented as percentage average ± s.e.m. N = 20 embryos. C caudal, D dorsal, DA dorsal aorta, PCV posterior cardinal vein, R rostral, V ventral. See also Supplementary table S1.

Macrophages in the AGM migrate in the mesenchymal way and undergo dynamic transition between different shapes over time. (a–f) Selected images from Video 1 illustrate the macrophage migration and shape transformation over time. Numbers point to individual macrophages. Time code is expressed in hours and minutes. White outlines on panel (bf) indicate the shape and position of macrophages from panel (a) (9th minute). (g,h) Rose plot diagrams show the directionality of macrophage migration in the AGM compared to the oriented migration of macrophages in the tail region after tail fin cut injury. A diagram represents the single counts of the position of each macrophage in the selected area (black and grey sectors of angle π/18) every minute over 60 min with a (x,y 0,0) starting point. n = 23 macrophages for the control and n = 27 for directed migration. (i) Bar plot show the comparable velocity between macrophages in the AGM and macrophages migrating toward a cut in the tail region. NS not significant; bar plot was generated in R using ggplot2 package. (j) Graph showing the shape evolution of individual macrophages during a 30 min course with 5 min interval measurements. Every line represents a single macrophage (n = 10). See also Video 1. Scale bar (af) 30 µm. See also Supplementary Figure S1.

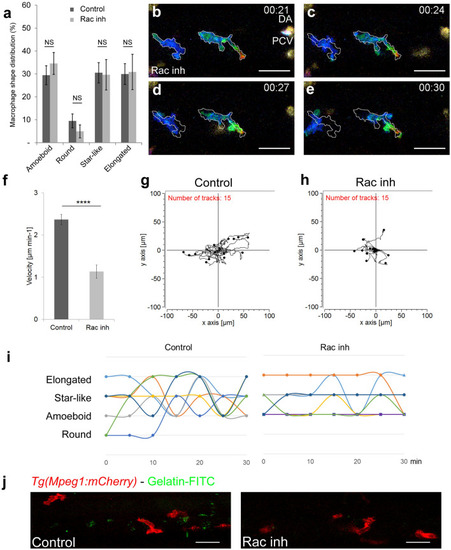
Rac inhibition leads to a loss of macrophage plasticity and motility. (a) Graph comparing macrophage shape distribution in the AGM of NSC23766 Rac-inhibited embryos (Rac Inh) to DMSO treated embryos (control) shows no significant change of distribution. N = 10 embryos for control and 15 for Rac inh. Data are represented as the mean of the percentage of each shape type in the total macrophage population in the AGM ± s.e.m. NS = not significant. (be) Selected cropped images from Video 2 showing the shape and migration of macrophages over time of Rac inhibited embryo. Time code in hours and minutes. White outlines on panel (ce) indicate the shape and position of macrophages from panel (b) (21st minute). (f) Graph showing the velocity of macrophages in control and Rac-inhibited embryos. Data are represented as a mean ± s.e.m., n = 15 macrophages from 4 different embryos, ****p < 0.0001. (g,h) Tracking plot diagram representing the migration path and distance of macrophages in the AGM in control and Rac-inhibited embryos measured every minute for 60 min. Scale in µm, n = 15 macrophages from 4 different embryos. (i) Graph shows the shape evolution of individual macrophages during a 30 min course with 5 min interval measurements, Control to the left, Rac inhibitor to the right. Each line represents a single macrophage (n = 7). Statistically significant differences exist in the number of shapes adopted during a 30 min measurement course (P = 0.003) as well as in the number of changes between two different shapes (P = 0.006). (j) In vivo zymography in Tg(Mpeg1:mCherry) embryos at 48 hpf reveals the degradation of inserted gelatin (green dots of cleavage-revealed FITC) in control embryos and a highly reduced degradation after Rac inhibition. See also Video 2. Scale bar 30 µm. See also Supplementary Figure S2.

MMP-9 inhibition induces a change in macrophage shape and a transition towards an amoeboid-like migration. (a) Graph compares the macrophage shape distribution in the AGM of MMP-2 and 9 (SB-3CT) -inhibited embryos (MMP inh) to DMSO treated embryos (control) shows an increase in round shape and a decrease in star-like and elongated shapes in MMP inh embryos. N = 10 embryos for control and 15 for MMP inh. Data represent the percentage mean for each shape type out of the total number of macrophages in the AGM ± s.e.m. NS not significant; *p < 0.05; ****p < 0.0001. (be) Selected cropped images from Video 3 displays macrophage shape and migration patterns over time. Numbers point to individual macrophages, time code is expressed in hours and minutes. Grey outlines on panel C-E show the shape and position of macrophages from panel (b) (3rd minute). (f) Graph showing the velocity of macrophages in control and MMP-inhibited embryos. Data are represented as a mean ± s.e.m., n = 17 macrophages for control and 14 for MMP inhibitor from 4 different embryos, ****p < 0.0001. (g,h) Tracking plot diagram represents the migration path and distance of macrophages in the AGM in control and MMP-inhibited embryos measured every minute over 60 min. Scale in µm, n = 17 macrophages for control and 14 for MMP inhibitor from 4 different embryos. See also Video 3. Scale bar 30 µm. DA dorsal aorta, PCV posterior cardinal vein.

Acknowledgments
This image is the copyrighted work of the attributed author or publisher, and ZFIN has permission only to display this image to its users. Additional permissions should be obtained from the applicable author or publisher of the image. Full text @ Sci. Rep.