
- Title
-
Brazilian silverside, Atherinella brasiliensis (Quoy & Gaimard,1825) embryos as a test-species for marine fish ecotoxicological tests
- Authors
- Feitosa, N.M., Calderon, E.N., da Silva, R.N., de Melo, S.L.R., Souza-Menezes, J., Nunes-da-Fonseca, R., Reynier, M.V.
- Source
- Full text @ Peer J.

(A, B, F–M, O, and P) lateral view and (C, D, E, and N) dorsal view. (A) 1-cell stage, considered 0 h from fertilization until first cleavage; (B) 2-cell stage, 0,67 hpf; (C) 4-cell stage, 1.33 h; (D) 8-cell stage, 2 h; (E) 16-cell stage, 2.67 h; (F) 32-cell stage, 3.3 h; (G) 64-cell stage, 4 h; (H) 128-cell stage; 4.67 h; (I) oblong stage; 9 h; (J) sphere stage, 15.5 h; (K) 25% epiboly, 17.5 h the embryo is on the right side (arrow); (L) 40% epiboly, 19 h embryo is on the right side (arrow); (M) 90% epiboly, 23.2 h; (N) optic vesicles forming at 90% epiboly stage (arrow); (O) 14-somite stage embryo, at 34 h showing Kupffer’s vesicle (arrowhead); (P) 18 somite stage, 38.3 h, the otic vesicle is apparent (arrow) (Scale—0.5 mm) |

(A) Bright field image showing the pigmented cells: dark brown (arrow) and black (arrowhead), (B) the same embryo image under a GFP filter, (C) dsRed filter and (D) merged images showing that only the dark brown pigmented cells are fluorescent in GFP and dsRED filters. Scale—0.5 mm. |

(A and C–I) lateral view, (B and I) dorsal view. (A) 40 h 20-somite stage; (B) dorsal view of 20-somite embryo with first pigmented cells appearing; (C) 48 h; (D) 72 hpf; (E and I) 96 h in I the arrow shows the tail tip at the level of the otic vesicle; (F, J and K) 120 h or 5 dpf, in J the spleen is visible only in a dorsal view (arrow), and in K, the tail tip (arrow) passes the otic vesicle (dashed ellipse); (G and L) 144 h or 6 dpf; (H and M) 168 h or 7 dpf; (M) dorsal view of 7 dpf larvae showing the spleen as a red spot (arrow); (N) composition picture of a 8-9 dpf hatching larvae. Scale—0.5 mm. The pictures A, C, D, E, F, G, H and N use the same scale bar. |
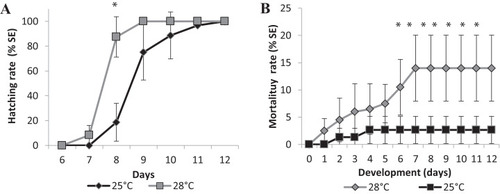
An asterisk (*) indicates significant statistical difference between the temperatures (ANOVA |

|

(A) Hatching rate of live embryos, in percentage, in mg·L−1. (B) Mortality rate of embryos, in percentage (± Standard Error), in mg·L−1. (A and B) the graphs correspond to cumulative data. An asterisk (*) indicates significant difference between the values on the corresponding day (ANOVA |