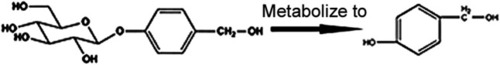
Chemical structure of GAS and HBA as well as metabolization of GAS into HBA in vivo.

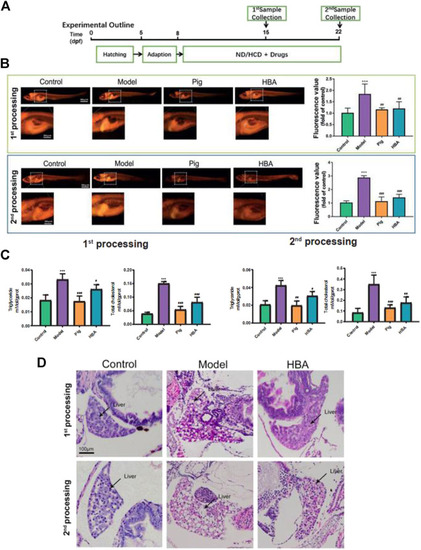
Effect of HBA in regulating lipid metabolism on an HCD-Induced Larval Zebrafish Model in two processes. (A) Experimental outline of the larval zebrafish experiment in vivo. (B) Nile red stain of larval zebrafish and fluorescent quantitation. (C) Triglyceride (TG,mmol/gprot) and total cholesterol (TC,mmol/gprot) of larval zebrafish. (D) Hematoxylin and eosin (HE) staining of larval zebrafish liver, macrovesicular steatosis, and the differences mentioned with black arrows. Bar indicate means ± SD. ***p < 0.001 represent compared with the control; #p < 0.05, ##p < 0.01, ###p < 0.001 represent compared with Model. p < 0.05 was considered as statistically significant calculated by One-way ANOVA followed by Tukey’s test (n = 3, n indicates the replicates of experiment).

Effect of HBA in oxidative stress on HCD-Induced Larval Zebrafish Model in two processes. (A) The ROS production showed in fluorescence image by DCFH-DA staining and merged with a light field image. (B) The ROS (Fluorescence value) and MDA concentration of each treated larval zebrafish group; The antioxidase SOD (U/gprot) and HO-1 level (ng/ml) of each treated larval zebrafish group. Bars indicate means ± SD. n. s. indicate no significant; **p < 0.01***p < 0.001 represent compared with the control; #p < 0.05, ##p < 0.01, ###p < 0.001 represent compared with Model. p < 0.05 was considered as statistically significant calculated by One-way ANOVA followed by Tukey’s test (n = 3, n indicates the replicates of the experiment).

Liver mRNA Expression Changes HBA on the Larval Zebrafish Model. (A,B) the gene expression level of lipogenesis and lipid-lowering of each treated larval zebrafish group in the first process B in the second process. (C,D) the gene expression level of inflammation and oxidant stress of each treated larval zebrafish group in the first process D in the second process. Bars indicate means ± SD. n. s. indicate no significant; *p < 0.05**p < 0.01***p < 0.001 represent compared with the control; #p < 0.05, ##p < 0.01, ###p < 0.001 represent compared with Model. p < 0.05 was considered as statistically significant calculated by One-way ANOVA followed by Tukey’s test (n = 3, n indicates the replicates of the experiment).

The effect of HBA on FFA-induced BRL-3A cell in vitro(A) Nile red staining of BRL-3A cells after 1 mm FFA with and without HBA (20 μM) treatment to reveal lipid level. (B) Measurement of ROS level in BRL-3A cells after 1 mm FFA with and without HBA (20 μM) treatment. (C) Fluorescence image of FITC-conjugated secondary antibody staining indicates the location of Nrf2 (green), DAPI staining indicates the location of the nucleus (blue), and the merged images show the nuclear location of Nrf2 protein. Red arrows show the HBA-induced translocation of Nrf2 to the nucleus. (D) mRNA expression profile of HBA on FFA induced BRL-3A cell related to lipogenesis and oxidant stress. Bar indicate means ± SD. **p < 0.01***p < 0.001 represent compared with the control; ##p < 0.01, ###p < 0.001 represent compared with Model. p < 0.05 was considered as statistically significant calculated by One-way ANOVA followed by Tukey’s test (n = 3, n indicates the replicates of the experiment).

Acknowledgments
This image is the copyrighted work of the attributed author or publisher, and ZFIN has permission only to display this image to its users. Additional permissions should be obtained from the applicable author or publisher of the image. Full text @ Front Pharmacol