FIGURE SUMMARY
Title

CRISPR gRNA phenotypic screening in zebrafish reveals pro-regenerative genes in spinal cord injury

Authors
Keatinge, M., Tsarouchas, T.M., Munir, T., Porter, N.J., Larraz, J., Gianni, D., Tsai, H.H., Becker, C.G., Lyons, D.A., Becker, T.
Source
Full text @ PLoS Genet.

<italic>In vivo</italic> pre-screening identifies highly active sCrRNAs.

A: Example gels to assess sCrRNA in vivo mutation rate by resistance to restriction enzyme digest (RFLP) are shown. These indicate > 90% mutation rate (top), medium mutation rate (middle) and no detectable mutation rate (bottom). Each lane is derived from one animal. The chart shows the distribution of > 350 sCrRNAs by in vivo mutation rate. B-D: Activities of individual sCrRNAs show weak correlation with predicted in silico efficiency using different prediction rules (see results). E: sCrRNA activities are not correlated with their relative position to the start codon in vivo.

Phenotypic screening reveals modifiers of spinal cord regeneration.

A: A schematic representation of the spinal cord regeneration assay. Percentages indicate expected proportions of larvae with an injury site bridged by axons in controls. B: Example images of unlesioned, non-bridged (star indicates gap of neuronal labeling) and bridged spinal cord (white arrow) are shown (lateral views). Scale bar = 50 μm. C: Results of spinal cord regeneration screen for all screened genes at 48 hpl are shown. Significant reductions in bridging, normalised to control lesioned animals, are observed for cst7 (p < 0.0001), sparc (p = 0.04), tgfb1a (p = 0.03), tgfb3 (p = 0.005), tnfa (p < 0.0001), ifngr1 (p = 0.0013,) hspd1 (p = 0.011), tbrg1 (p = 0.0494, serpinb1 (p = 0.0279), and mertk (p = 0.0195); * indicates significance at 48 hpl; # indicates significance at 24 hpl (see S2 Fig); number of larvae per experiment are indicated at the bottom of each bar. For dpm3 no viable larvae could be raised. A single sCrRNA targeting a key functional domain was used to target ctsd, abca7, sparc, clip3, abca1b, tnfa, tgfb1a and tgfb3. Two sCrRNAs were used to target all remaining genes. D: Mutant analysis confirms axonal phenotypes for sparc (p = 0.0189), tgfb1a (p = 0.019), tgfb3 (p = 0.043) and tnfa (p = 0.024), but not for cst7 (p = 0.079) at 48 hpl. The table compares the magnitude of effects between acute injection and in mutants. Fischer’s exact test was used for all analyses.

PHENOTYPE:
Fish:
Condition:
Knockdown Reagents:
Observed In:
Stage Range: Day 4 to Day 5

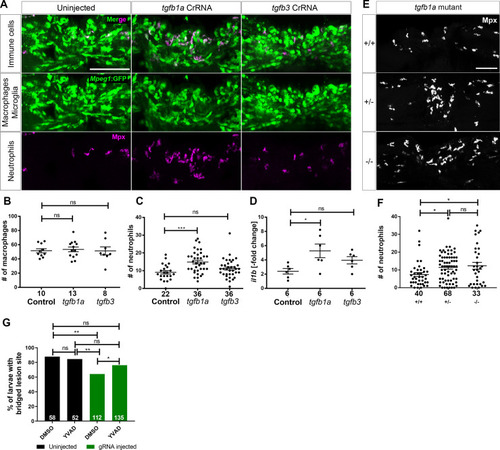
Loss of <italic>tgfb1a</italic> leads to prolonged inflammation.

A: Lateral views of lesion sites in larval zebrafish are shown with the indicated markers and experimental conditions at 48 hpl. B-C: Quantifications show that numbers of macrophages were not altered by injecting any of the indicated haCRs (B; one-way ANOVA with Bonferroni’s multiple comparison test; Theoretical power = 0.85 to see a similar increase as for neutrophils in C), neutrophils were increased in number in tgf1b haCRs injected animals (one-way ANOVA with Bonferroni’s multiple comparison test, P = 0.0006), but not in tgfb3 haCRs injected animals (p = 0.32). D: Animals injected with tgfb1a haCRs, but not those injected with tgfb3 haCRs (P = 0.36), displayed marked increases in il1b expression levels in the lesion site compared to lesioned controls at 48 hpl (one-way ANOVA with Bonferroni’s multiple comparison test, P = 0.0211). All transcript levels were normalized to uninjected, unlesioned controls. E-F:tgfb1a heterozygous (one-way ANOVA with Tukey’s multiple comparison test, P = 0.0497) and homozygous mutant animals (P = 0.039) show increased numbers of neutrophils, comparable to haCR-injected animals. G: Inhibition of Il-1β with YVAD rescued axonal bridging compared to the DMSO-treated control group in animals injected with tgfb1a haCRs (Fisher’s exact test * p <0.05, ** p<0.01). Numbers in B, C, F indicate numbers of animals; in D numbers of independent experiments. Error bars represent standard error of the mean (SEM). Scale bars = 50 μm.

Acknowledgments
This image is the copyrighted work of the attributed author or publisher, and ZFIN has permission only to display this image to its users. Additional permissions should be obtained from the applicable author or publisher of the image. Full text @ PLoS Genet.