FIGURE SUMMARY
Title

Quantitative proteome comparison of human hearts with those of model organisms

Authors
Linscheid, N., Santos, A., Poulsen, P.C., Mills, R.W., Calloe, K., Leurs, U., Ye, J.Z., Stolte, C., Thomsen, M.B., Bentzen, B.H., Lundegaard, P.R., Olesen, M.S., Jensen, L.J., Olsen, J.V., Lundby, A.
Source
Full text @ PLoS Biol.

Multispecies proteome mapping across cardiac chambers.

(a) Workflow for the determination of chamber-specific cardiac proteomes in human, horse, pig, rat, mouse, and zebrafish. Tissue biopsies were collected in triplicates. Biopsies were homogenized followed by protein extraction and digestion, desalted peptides were then fractionated, and the generated peptide fractions were analyzed by LC–MS/MS. Data were analyzed using MaxQuant and Perseus software. (b) Table summarizing the number of proteins measured in each species across cardiac chambers. HPLC, high-pressure liquid chromatography; LA, left atrium; LC–MS/MS, liquid chromatography tandem mass spectrometry; LV, left ventricle; RA, right atrium; RV, right ventricle.

Website interface of cardiac protein expression database across species.

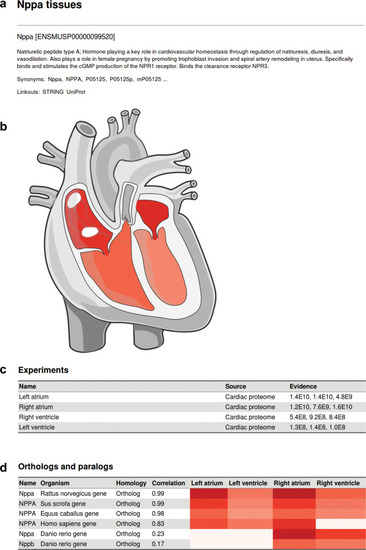
Example interface when searching for a protein of interest; example here is Nppa in mouse. (a) Detailed information of the queried protein as extracted from UniProt. A link for protein–protein interaction network of the protein as reported in STRING is provided. (b) Our measured protein expression across mouse heart chambers are displayed on a color scale in a graphic representation of the heart. (c) Table summarizing the measured experimental data. In this case, MS-based intensities were measured in all triplicates from all chambers. The measured protein intensity is provided in the “Evidence” column. Protein abundance is 2 orders of magnitude greater in the atria than in the ventricles. (d) All orthologs and paralogs identified in the dataset for Nppa are displayed in an adjacent table for comparison. In the database, measured protein intensities are translated into a multispecies confidence score for improved comparability. Nppa, natriuretic peptide type A.

Protein abundance profiles across species.

(a) Unsupervised hierarchical clustering of normalized protein intensities, for proteins measured in all samples resulted in grouping of samples from the same organism and reflects evolutionary distance between species as well as specific similarities and differences in protein expression. Proteins are colored by intensity with red showing highest and blue showing lowest intensity values (color bar denotes log2-transformed normalized protein intensities). (b) Visual representation of GO enrichment analysis of proteins with significantly different (upper panel) or similar (lower panel) abundance profiles across all species. Shown are representative enriched terms for GO, BP, CC, and MF, as well as KEGG pathways. Sizes of boxes are proportional to −log10 (p-value) of the enrichment (the larger, the more significant), and numbers denote the number of proteins enriched in the respective category. BP, biological process; CC, cellular component; GO, gene ontology; KEGG, Kyoto Encyclopedia of Genes and Genomes; MF, molecular function.

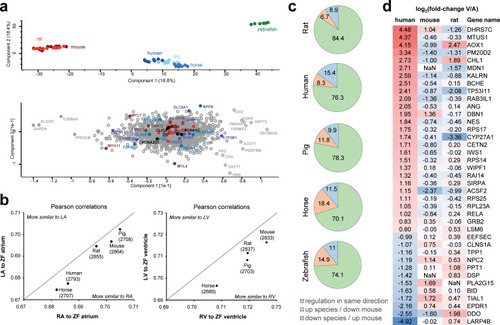
(a) PCA (top) shows that the main sources of variation in the dataset are contributed by (i) the zebrafish samples (green) being different from all mammalian samples; and (ii) small mammals (red) being different from large mammals (blue). Analysis of which proteins explain most of the sample variance between samples (bottom) highlights, e.g., MYL4 and MYL7 showing high variance between zebrafish and large mammals along component 2, as well as NPPA, MYH11, and SLC8A1 highlighted as major contributors to the intermammalian differences. Reference sets of mitochondrial proteins are highlighted in orange, which show comparably lower loadings. This analysis is based on data presented in S8 Table. (b) Analysis of zebrafish protein abundance profile in atria and ventricle compared to corresponding mammalian protein abundance profiles in left and RV and atria. Pearson correlation analysis across all proteins consistently shows higher similarity to right side of the mammalian hearts, for ventricle as well as atria. This analysis is based on data presented in S8 Table. (c) Comparison of protein abundance differences between atria and ventricles across species. Protein abundances in ventricle compared to atria were calculated for mouse heart, and ratios were compared to all other species. Pie charts illustrate the percentage of proteins showing same direction of regulation (green), higher abundance in atria in other species in contrast to mouse (orange), and higher abundance in ventricle in other species contrary to finding in mouse (blue). (d) Proteins significantly differentially expressed between human ventricle and atria, which show opposite abundance profile in mouse and/or rat compared to human. log2 fold change of atria versus ventricle are shown, i.e., proteins higher expressed in ventricle are denoted positive (red), and those higher expressed in atria are denoted negative (blue). LA, left atrium; PCA, principal component analysis; RA, right atrium; RV, right ventricle.

Protein abundance profiles for cardiac disease–associated proteins across species.

(a, b) Median protein abundances in LVs are shown for proteins reported to be involved in HCM (panel a) and DCM (panel b) across species. Color scale represents log2-transformed protein intensities (red: highest abundance, turquoise: lowest abundance, and gray: not available). (c) Comparison of protein abundance ratios between atria and ventricle for proteins encoded by 7 genes involved in ARVC. log2 fold change between ventricle and atria are shown. Note that the human ratio profile is best reflected by pig, while profiles in other species differ markedly. Bar height denotes the sample mean, and error bars denote standard deviation. This analysis is based on data presented in S8 Table. ARVC, arrhythmogenic right ventricular cardiomyopathy; DCM, dilated cardiomyopathy; HCM, hypertrophic cardiomyopathy; LV, left ventricle.

Acknowledgments
This image is the copyrighted work of the attributed author or publisher, and ZFIN has permission only to display this image to its users. Additional permissions should be obtained from the applicable author or publisher of the image. Full text @ PLoS Biol.