
- Title
-
Disruption of Cxcr3 chemotactic signaling alters lysosomal function and renders macrophages more microbicidal
- Authors
- Sommer, F., Torraca, V., Xie, Y., In 't Veld, A.E., Willemse, J., Meijer, A.H.
- Source
- Full text @ Cell Rep.
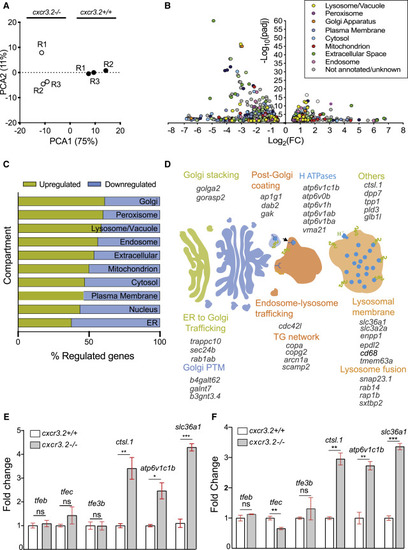
Disruption of Cxcr3.2 signaling transcriptionally induces genes related to lysosomal function and intracellular vesicle trafficking (A) Principal-component analysis (PCA) of cxcr3.2 mutant (cxcr3.2−/−) and WT (cxcr3.2+/+) transcriptomes. PCA analysis was performed in R on variance-stabilizing transformed (vst) data, using the DESeq2 plotPCA command. (B) Volcano plot of cxcr3.2 mutant versus WT differentially expressed genes. Genes are classified and color-coded by cellular compartment annotation. Compartment annotations were obtained from http://geneontology.org according to the GO cellular component and from KEGG pathways. (C) Distribution of upregulated (yellow) and downregulated (blue) genes, classified by compartment as above. Lysosomal, Golgi, and peroxisome-related genes are more commonly upregulated in cxcr3.2 mutant macrophages. (D) Graphical representation of induced genes exerting key functions in Golgi and lysosomal pathways. ER, endoplasmic reticulum; PTM, post-translational modification; TG, trans-Golgi. (E and F) Expression fold change of representative lysosomal markers and transcriptional regulators of lysosomal functions of cxcr3.2 mutant and WT FACS macrophages, as determined by qPCR (E) or RNA-seq analysis (F). qPCR analysis confirmed that overall lysosomal function is increased in cxcr3.2 mutants as indicated by the upregulation of lysosomal function markers ctsl.1, atp6v1c1b, and slc36a1, whereas the expression of the lysosomal biogenesis regulators tfeb, tfe3, and tfec remained unaltered. Three biological samples of 150–200 larvae were used, and three technical replicates were conducted. Data were analyzed using a two-tailed t test and results are shown as mean ± SEM (∗p ≤ 0.05, ∗∗p ≤ 0.01, ∗∗∗p ≤ 0.001; ns, not significant [p > 0.05]). |
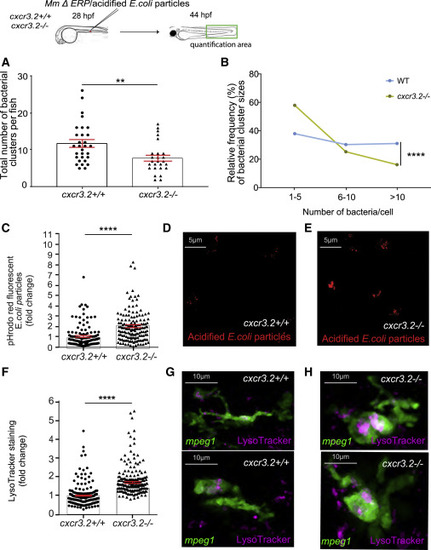
Upregulation of lysosomal genes in cxcr3.2 mutants is linked with increased microbicidal activity of macrophages (A and B) Quantification of M. marinum ΔERP bacterial clusters in the indicated area showed that infected cxcr3.2 mutants develop fewer bacterial clusters (A) and that cxcr3.2 mutants had mostly small bacterial clusters (1–5 bacteria) and few large clusters (>10 bacteria) compared to the WT (B). (C–E) Normalized intensity of pH-rodo E. coli bioparticle clusters in cxcr3.2 mutants (cxcr3.2−/−) was higher than in WT larvae (cxcr3.2+/+) based on fluorescence quantification (C). Data are expressed as fold change with the average fluorescence intensity in the WT set to 1. Representative confocal images show pH-rodo staining in WT (D) and cxcr3.2 mutant (E). (F–H) Normalized data of LysoTracker staining showed that macrophages (mpeg1:mCherry-F-positive) in cxcr3.2 mutants (cxcr3.2−/−) had higher lysosomal staining than in WT larvae (cxcr3.2+/+) based on fluorescence quantification (F). Data are expressed as fold change with the average fluorescence intensity in the WT set to 1. Representative images are still confocal images of live WT (G) or cxcr3.2 mutant (H) macrophages (shown in green) with LysoTracker staining (shown in pink). A Mann-Whitney test was used to analyze the total number of bacterial clusters per fish of pooled data of two independent replicates of 12–15 fish each (A, C, and F), and a Kolmogorov-Smirnov test was used to analyze the distribution of bacterial cluster sizes (B). All data are shown as mean ± SEM (∗∗p ≤ 0.01, ∗∗∗∗p ≤ 0.0001). |

tfec function counteracts enhanced microbicidal capacity of cxcr3.2 mutants (A–D) We inhibited Tfec function with the DN-tfec construct (A and B) or overexpressed the gene with the CMV:tfec construct (C and D) in WT embryos (AB/TL) and subsequently infected them with M. marinum mCherry (representative examples are shown). Larvae injected with DN-tfec had a lower bacterial burden than did PBS injected controls at 4 days post-infection (dpi) (A and B), while CMV:tfec injected larvae had a higher bacterial burden (C and D). (E and F) M. marinum ΔERP-infected WT larvae (AB/TL) previously injected with DN-tfec developed fewer (E) and smaller (F) bacterial clusters than did PBS controls and phenocopied cxcr3.2 mutants in their capacity to clear bacteria. (G and H) CMV:tfec-injected cxcr3.2 mutants (cxcr3.2−/−) infected with M. marinum ΔERP lost their enhanced microbicidal capacity and had more (G) and larger (H) bacterial clusters than did WT controls (cxcr3.2+/+). Overall bacterial burden data were analyzed using a two-tailed t test (A–D). Total bacterial clusters per fish were analyzed using a Mann-Whitney test and combined data of three independent replicates of 20–30 larvae (E and G). A Kolmogorov-Smirnov test was used to analyze the distribution of bacterial cluster sizes (F and H). All data are shown as mean ± SEM (∗p ≤ 0.05, ∗∗p ≤ 0.01, ∗∗∗p ≤ 0.001 ∗∗∗∗p ≤ 0.0001; ns, not significant [p > 0.05]). |
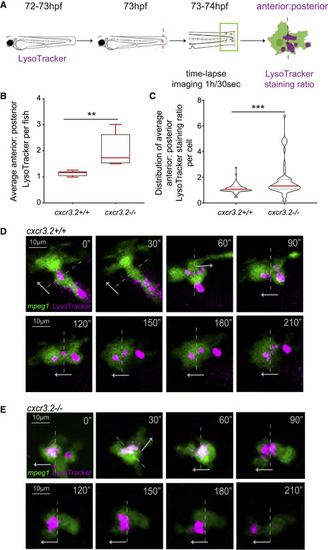
Disruption of Cxcr3.2 signaling in macrophages alters lysosome trafficking and prevents cell polarization during chemotaxis We assessed lysosome localization during chemotaxis by quantifying the ratio of LysoTracker signal (shown in pink) in the anterior and posterior halves of migrating macrophages (mpeg1:mCherry-F labeled, shown in green). (A) LysoTracker stained Tg(mpeg1:mCherry-F) cxcr3.2 mutant (cxcr3.2−/−) and WT larvae (cxcr3.2+/+) were time-lapse imaged directly after tail amputation. (B–E) Data shown in (B) and (C) derive from a total of 63 macrophages in 5 WT larvae (representative images in D) and 57 macrophages in 5 cxcr3.2 mutant larvae (representative images in E), with at least 7 macrophages analyzed per fish in all cases. Graphs show the average anterior/posterior LysoTracker staining ratio per fish (B) and the average staining ratio per cell (C). Stills at 30-s intervals from representative cells (D and E) and graphs (B and C) show that lysosomes in WT display a small dispersion in the data (B and C) and an even distribution of lysosomes (D), while lysosomes preferentially accumulate in the anterior half in cxcr3.2 mutant macrophages (E) and show a high variation (B and C). The background of representative images was removed to better show lysosomal distribution in single cells. Dashed lines divide anterior and posterior halves, and arrows indicate the direction of macrophage movement. Data of anterior/posterior LysoTracker staining per fish were analyzed with a Mann-Whitney test, and data per cell were analyzed using a two-tailed t test. Results are shown as mean ± SEM (∗∗p ≤ 0.01, ∗∗∗p ≤ 0.001). |