
- Title
-
Characterization of Four Orphan Receptors (GPR3, GPR6, GPR12 and GPR12L) in Chickens and Ducks and Regulation of GPR12 Expression in Ovarian Granulosa Cells by Progesterone
- Authors
- Li, Z., Jiang, B., Cao, B., Zhang, Z., Zhang, J., Li, J., Huang, Y., Wang, Y.
- Source
- Full text @ Genes (Basel)

ZFIN is incorporating published figure images and captions as part of an ongoing project. Figures from some publications have not yet been curated, or are not available for display because of copyright restrictions. |
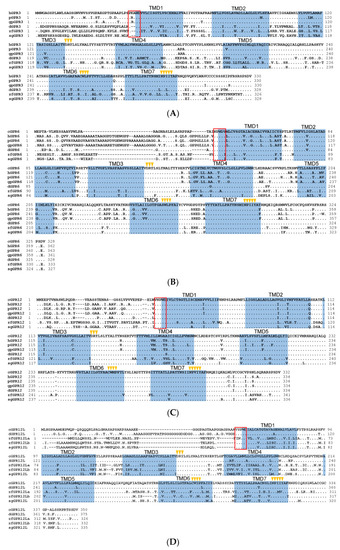
Amino acid sequence alignment of G protein-coupled receptor 3 (GPR3), GPR6, GPR12, and GPR12L in vertebrates. (A) Alignment of the cloned duck (d-)/zebrafish (zf-)/pig (p-) GPR3 with that of humans (hGPR3, NP_005272.1), giant pandas (gpGPR3, XP_034503372.1) and spotted gars (sgGPR3, XP_015204111.1); (B) Alignment of the cloned chicken(c-)/duck(d-)/zebrafish(zf-)/pig(p-) GPR6 with that of humans (hGPR6, NP_005275.1), giant pandas (gpGPR6, XP_002925693.2), and spotted gars (sgGPR6, XP_006626355.1); (C) Alignment of the cloned chicken (c-)/duck (d-)/zebrafish (zf-)/pig (p-) GPR12 with that of humans (hGPR12, NP_005279.1), giant pandas (gpGPR12, XP_002924260.1), and spotted gars (sgGPR12, XP_015196669.1); (D) Alignment of the cloned chicken (c-)/duck (d-)/zebrafish (zf-) GPR12L with that of anole lizard (lGPR12L, XP_028571577.1) and spotted gars (sgGPR12L, XP_015206591.1). The seven transmembrane domains (TMD1–7) and N-glycosylation sites (NXT/S) are shaded; the XXXWD motif is boxed; conserved motifs (DRY, XWXP, and NPXXY) are marked by arrowheads; (E) Exon–intron organization of chicken GPR6, GPR12, and GPR12L. The red boxes indicate the coding region, and the numbers inside denote the size (in bp); while the blue box represents the untranslated regions, (UTRs) and the number within specifies the size (in bp). |

Amino acid sequence alignment of G protein-coupled receptor 3 (GPR3), GPR6, GPR12, and GPR12L in vertebrates. (A) Alignment of the cloned duck (d-)/zebrafish (zf-)/pig (p-) GPR3 with that of humans (hGPR3, NP_005272.1), giant pandas (gpGPR3, XP_034503372.1) and spotted gars (sgGPR3, XP_015204111.1); (B) Alignment of the cloned chicken(c-)/duck(d-)/zebrafish(zf-)/pig(p-) GPR6 with that of humans (hGPR6, NP_005275.1), giant pandas (gpGPR6, XP_002925693.2), and spotted gars (sgGPR6, XP_006626355.1); (C) Alignment of the cloned chicken (c-)/duck (d-)/zebrafish (zf-)/pig (p-) GPR12 with that of humans (hGPR12, NP_005279.1), giant pandas (gpGPR12, XP_002924260.1), and spotted gars (sgGPR12, XP_015196669.1); (D) Alignment of the cloned chicken (c-)/duck (d-)/zebrafish (zf-) GPR12L with that of anole lizard (lGPR12L, XP_028571577.1) and spotted gars (sgGPR12L, XP_015206591.1). The seven transmembrane domains (TMD1–7) and N-glycosylation sites (NXT/S) are shaded; the XXXWD motif is boxed; conserved motifs (DRY, XWXP, and NPXXY) are marked by arrowheads; (E) Exon–intron organization of chicken GPR6, GPR12, and GPR12L. The red boxes indicate the coding region, and the numbers inside denote the size (in bp); while the blue box represents the untranslated regions, (UTRs) and the number within specifies the size (in bp). |
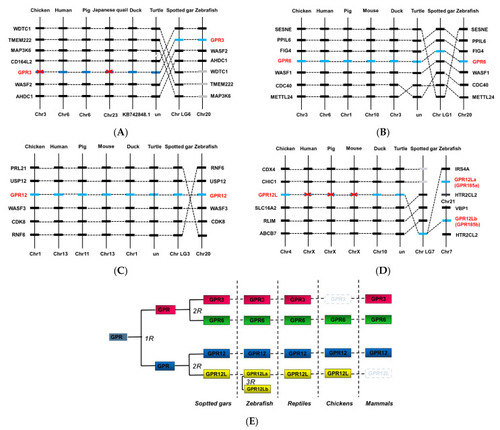
Synteny analysis of GPR3, GPR6, GPR12, and GPR12L in chickens and other vertebrates. GPR3 (A), GPR6 (B), GPR12 (C), and GPR12L (D) are located in four syntenic regions conserved in vertebrate species including chickens, ducks, humans, pigs, turtles, spotted gars, and zebrafish. Dashed lines denote the genes of interest, while dotted lines indicate the syntenic genes identified in these species. Chr, chromosome. (E) Schematic diagram showing the existence of GPR3, GPR6, GPR12, and GPR12L in vertebrate species including spotted gars, teleosts (e.g., zebrafish), turtles, chicken, and mammals. GPR3, GPR6, GPR12, and GPR12L were likely duplicated from a common ancestral gene (denoted as “GPR”), which had undergone the two rounds of genome duplication event (2R) during early vertebrate evolution. The two GPR12L genes in zebrafish likely originated from the 3rd round (3R) genome duplication event occurred in teleost lineage. |
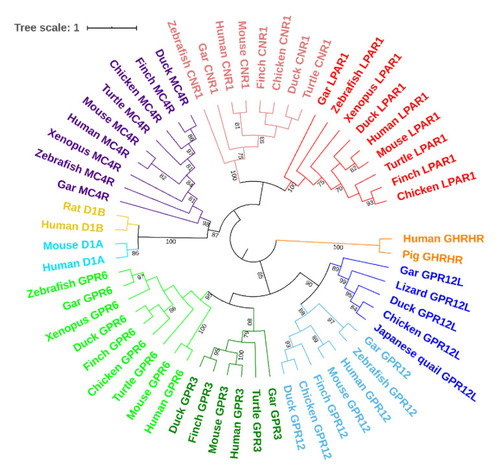
The phylogenetic tree of vertebrate GPR3, GPR6, GPR12, GPR12L, melanocortin 4 receptor (MC4R), cannabinoid receptor 1 (CNR1), and lysophosphatidic acid receptor 1 (LAPR1), dopamine receptor 1A (D1A), and dopamine receptors (D1B) constructed by MEGA7 software (maximum likelihood method). The GPR3 cluster is highlighted in deep green; the GPR6 cluster in orange; the GPR12 cluster in brown; the GPR12L cluster in purple. |
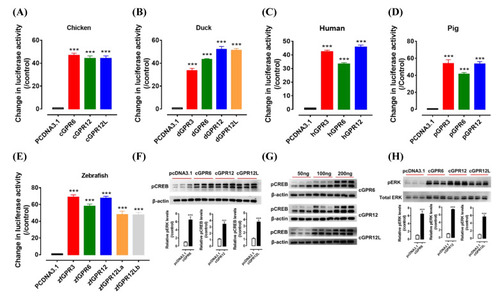
Constitutive activity of GPR3, GPR6, GPR12, and GPR12L(s) in chicken (A), duck (B), human (C), pig (D), and zebrafish (E). The activity of each receptor expressed in human embryonic kidney 293 (HEK293) cells was detected by dual-luciferase reporter assay. Each data point represents the mean ± SEM of 4 replicates (N = 4). ***, p < 0.001 vs. control (cells transfected with empty pcDNA3.1(+) vector). Western blot detection of the phosphorylated CREB (pCREB, (F)) and ERK (pERK, (H)) in HEK293 cells expressing cGPR6, cGPR12, and cGPR12L. pCREB and pERK levels were first normalized by that of actin and total ERK (tERK), respectively, and then expressed as the fold increase compared with the control group (transfected with empty pcDNA3.1(+) vector). ***, p < 0.001 vs. control. (G) The levels of pCREB increase dose-dependently in HEK293 cells transfected with increasing amount of cGPR6, cGPR12, or cGPR12L expression plasmid (50 ng, 100 ng, and 200 ng). Note. zebrafish has two GPR12L genes (GPR12La and GPR12Lb). |
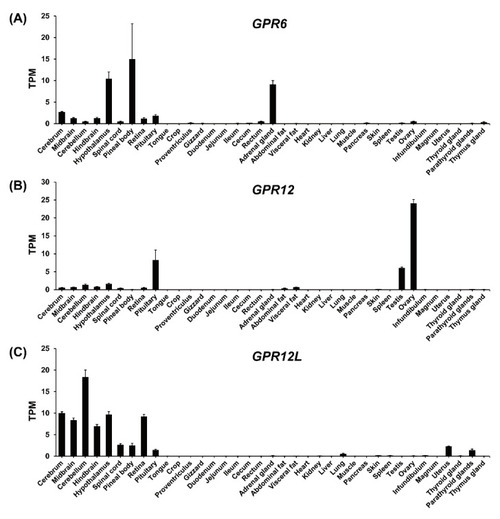
RNA-seq data analysis showing the expression of GPR6 (A), GPR12 (B), and GPR12L (C) in adult chicken tissues. Each data point represents the mean ± SEM of 6 individual adult chickens (3 males and 3 females) (N = 6). |
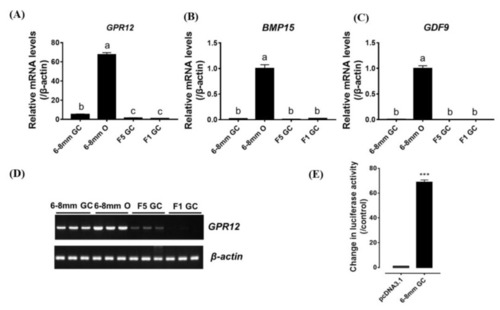
( |
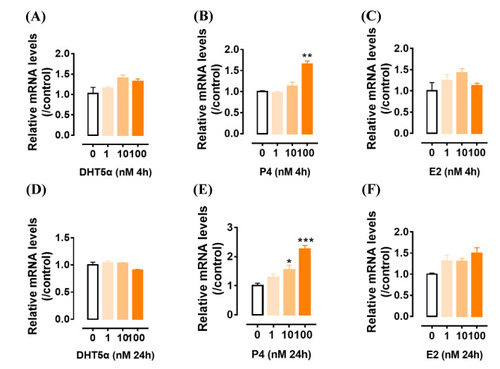
The effects of androgen (DHT5α) ( |
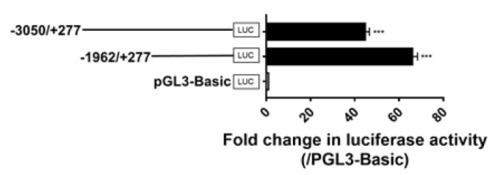
Detection of promoter activities of the 5′-flanking region of chicken GPR12 in cultured chicken fibroblast cells line (DF-1). Various lengths of the 5′-flanking regions of cGPR12 were cloned into pGL3-Basic vector for the generation of multiple promoter-luciferase constructs (−3050/+277 Luc and −1962/+277 Luc). These promoter-luciferase constructs were then co-transfected into DF-1 cells along with pRL-TK vector, and their promoter activities were determined by dual-luciferase reporter assays. The transcriptional start site identified by 5′-RACE was designated as “+1” (see Figure S1). Each value represents the mean ± SEM of four replicates (N = 4). *** p < 0.001 vs. pGL3-Basic vector. |