Cilia formation is largely normal in <italic>alms1</italic> mutants.

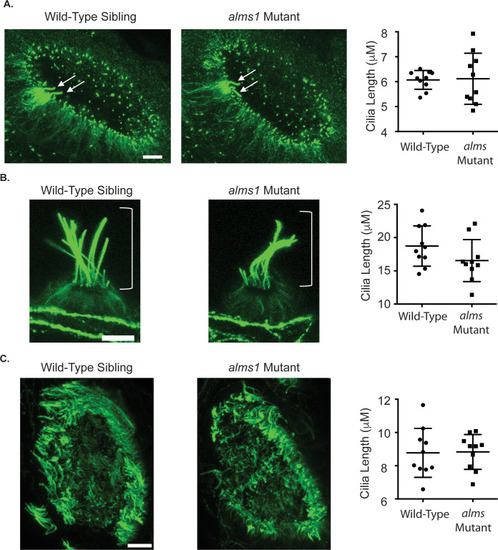
(A) Representative images of the otic vesicle of a 24 hpf wild-type (left) and alms1 mutant (center) zebrafish embryo stained with acetylated tubulin. The arrows point to the cilia of the early hair cells. To the right is quantification of cilia length. There was no significant difference in average kinocilia length between wild-type and mutant zebrafish, however, there was more variation in length seen in alms1 mutants. (p = 0.0065 by F test to compare variances) (B) Representative images of the IO1 neuromast stained with acetylated tubulin in wild-type (left) and alms1 mutant (center) 5dpf zebrafish larvae. The brackets show the position of the kinocilia. Kinocilia appear grossly normal in alms1 mutant fish. To the right is quantification of IO1 kinocilia length. There was no significant difference between wild-type and mutant zebrafish (p = 0.1312 by an unpaired t-test) (C) Representative images of the olfactory pit stained with acetylated tubulin in wild-type (left) and alms1 mutant (center) 5dpf zebrafish larvae. Again cilia appear grossly normal in alms1 mutants. To the right is quantification of cilia length in the olfactory pit. There was no significant difference between wild-type and mutant zebrafish (p = 0.9247 by unpaired t-test). Scale bar for all images = 10 μm. Quantification graphs show individual data points along with the mean and standard deviation of the data, n = 10 fish per group.

ZFIN is incorporating published figure images and captions as part of an ongoing project. Figures from some publications have not yet been curated, or are not available for display because of copyright restrictions.

PHENOTYPE:
Fish:
Observed In:
Stage: Day 5

FM1-43 loading is normal in <italic>alms1</italic> mutants.

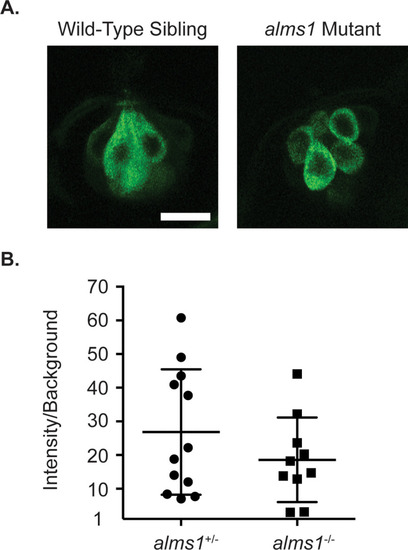
(A) Representative images of neuromasts from wild-type siblings (left) and alms1 mutants (right) treated with FM1-43. Scale bar = 10 μm. (B) Quantification of the fluorescent intensity of FM1-43 in neuromasts of heterozygous wild-type siblings and homozygous alms1 mutants. There was no significant difference between the two groups by an unpaired t-test (p = 0.2474). Individual data points are shown along with the mean and standard deviation of the data.

ZFIN is incorporating published figure images and captions as part of an ongoing project. Figures from some publications have not yet been curated, or are not available for display because of copyright restrictions.

Adult <italic>alms1</italic> mutant fish are not resistant to neomycin-induced hair cell death.

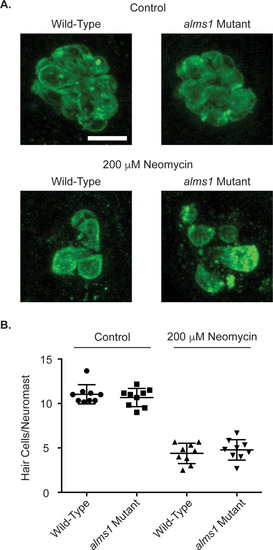
(A) Representative images of neuromasts from control (top) and neomycin treated (bottom) fish from wild-type (left) and alms1 mutant (right) fish. (B) Quantification of hair cells/neuromast either in control conditions or following treatment with 200 μM neomycin. Individual data points are shown along with the mean and standard deviation. There were no significant differences due to genotype (p = 0.3073) or the interaction between genotype and neomycin (p = 0.9784) by two-way ANOVA.

ZFIN is incorporating published figure images and captions as part of an ongoing project. Figures from some publications have not yet been curated, or are not available for display because of copyright restrictions.

PHENOTYPE:
Fish:
Observed In:
Stage: Adult
Acknowledgments
This image is the copyrighted work of the attributed author or publisher, and ZFIN has permission only to display this image to its users. Additional permissions should be obtained from the applicable author or publisher of the image. Full text @ PLoS One