FIGURE SUMMARY
Title

NOX5 is expressed aberrantly but not a critical pathogenetic gene in Hirschsprung disease

Authors
Wang, J., Xiao, J., Meng, X., Chu, X., Zhuansun, D.D., Xiong, B., Feng, J.
Source
Full text @ BMC Pediatr

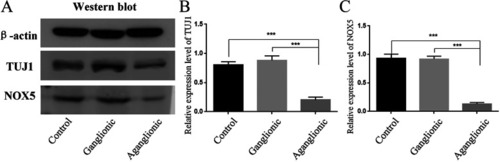
Western blotting revealed significantly increased protein expression levels of NOX5 and Tuj1 in the ganglionic HSCR specimens (n = 10) compared to aganglionic and normal control tissue (n = 10). Equal loading of electrophoresis gels was confirmed by ACTIN staining (p < 0.001 by one-way ANOVA)

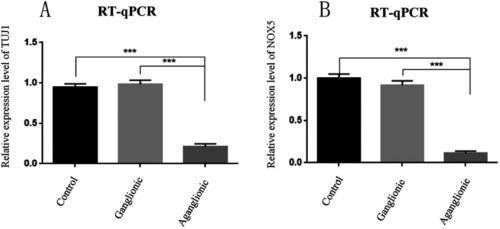
The qPCR results revealed significantly increased expression of NOX5 and Tuj1 in the ganglionic HSCR specimens (n = 10) compared to aganglionic and normal control tissue (n = 10). (p < 0.001 by one-way ANOVA)

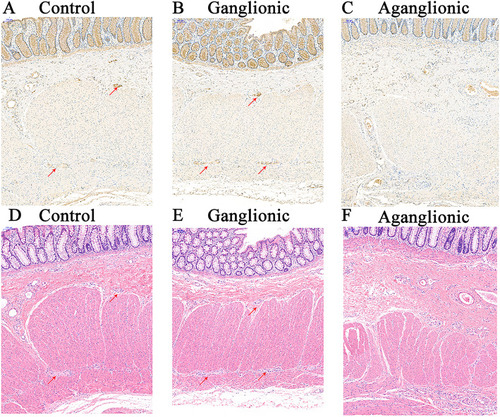
NOX5 antibodies positively stained ganglion cells (arrows) in the submucosal and myenteric plexus of the ganglionic (a, d, × 100) and normal colon (c, f, × 100) but not aganglionic colon (b, e, × 100). Each ISH section have a correspondent HE staining slide

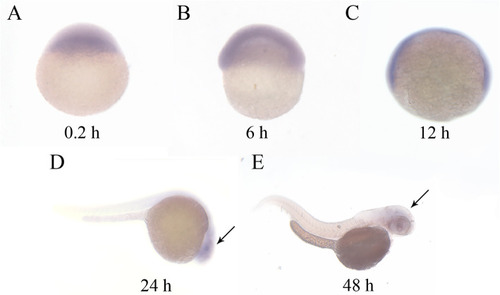
Broad NOX5 expression through the first 2 days of development. a-e: 0.2, 6, 12, 24, and 48 hpf. d-e: Lateral views of whole-mount ISH embryos probed with NOX5 antisense show a relative specific positive expression in central nervous system

EXPRESSION / LABELING:
Gene:
Fish:
Anatomical Terms:
Stage Range: 1-cell to Protruding-mouth

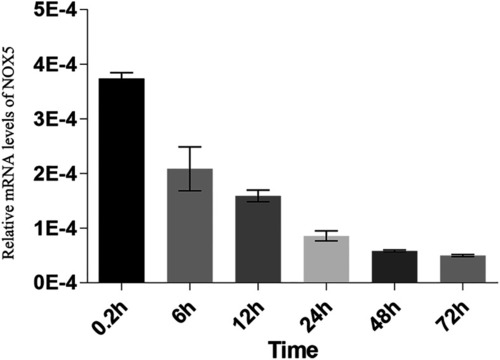
NOX5 expressed during early zebrafish development. Relative mRNA levels of NOX5 derived via quantitative PCR normalized to ACTIN. N = 6 for each data point

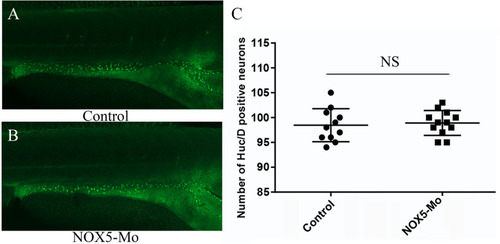
Immunostaining with HuC/D at 5dpf show no difference between control group (a) and NOX5-MO group (b). No statistical difference in HuC/D+ neuron numbers between two groups (c)

EXPRESSION / LABELING:
Antibody:
Fish:
Knockdown Reagent:
Anatomical Term:
Stage: Day 5
PHENOTYPE:
Fish:
Knockdown Reagent:
Observed In:
Stage: Day 5

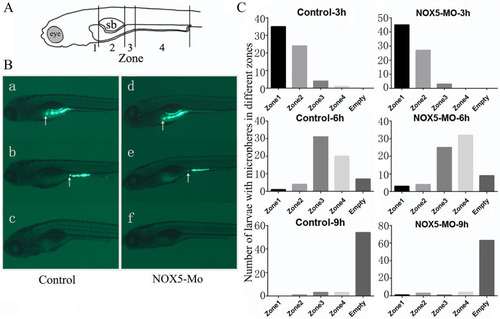
To evaluate intestinal transit at the population level, we categorized individuals within a population based on the location of tracer in the gastrointestinal tract. a Regions of the gut are divided to 4 zones based on anatomical landmarks. Zone 1 is the region of the intestinal bulb rostral to the swim bladder. Zone 2 is the region of the intestinal bulb ventral to the swim bladder. Zone 3 is the junction between the intestinal bulb and the mid intestine. Zone 4 consists of the mid- and posterior intestine. e, eye; sb, swim bladder. b Larvae were scored as zone 1, zone 2, zone 3, zone 4 and empty based on the anterior extent of tracer in the gastrointestinal tract (arrow). c Bar graphs representing the transit profile of a population of 7 dpf larvae at 3 h, 6 h, 9 h of transit time. Data are represented as the number of larvae classified into each zone category based on visual analysis of live larvae at the time specified. The difference of transit profiles of all time points between two groups show no statistically significant (P > 0.05)

PHENOTYPE:
Fish:
Knockdown Reagent:
Observed In:
Stage: Days 7-13
Acknowledgments
This image is the copyrighted work of the attributed author or publisher, and ZFIN has permission only to display this image to its users. Additional permissions should be obtained from the applicable author or publisher of the image. Full text @ BMC Pediatr