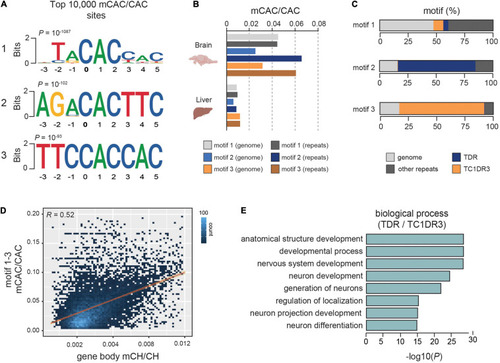
mCH is enriched at defined CAC-containing motifs in zebrafish brains. (A) Top three motifs called from the 10,000 most methylated CAC trinucleotides in the zebrafish brain. (B) Average mCAC/CAC methylation levels of the top three mCAC motifs in the bulk genome and repetitive elements of zebrafish brain and liver. (C) Genomic annotation of top ranked CAC motifs. (D) Genomic correlation between average gene body mCH/CH and mCAC/CAC at top three most methylated CAC motifs. (E) Gene ontology enrichment of genes containing methylated CAC motifs in TDR and TC1DR3 elements.

mCH is present at long genes with low expression levels. (A) mCH/CH levels, mCAC/CAC levels, and gene expression represented as transcripts per million (TPM) in adult zebrafish brains. (B) Genome browser snapshot of mCAC/CAC levels in cluster 1 (red) and cluster 2 (black) genes in adult brains. (C) Comparisons of gene length (top left), average gene mCAC/CAC (top right), average exon mCAC/CAC (bottom left) and average intron mCAC/CAC (bottom right) in genes with high (cluster 1) and moderate/low levels of mCAC/CAC (cluster 2) (Wilcoxon test, ∗∗∗P < 0.001). (D) Tc1-like element percentage of total gene length in genes with high (cluster 1) and moderate/low levels of mCAC/CAC (cluster 2) (Wilcoxon test, ∗∗∗P < 0.001). (E) Average expression levels (TPM) in 6-month old brains (n = 5) and neurons (n = 30) at genes with high (cluster 1), or moderate/low (cluster 2) mCH, and a random subset of genes (n = 1,860) sampled from cluster 2 (Wilcoxon test, ∗∗∗P < 0.001).

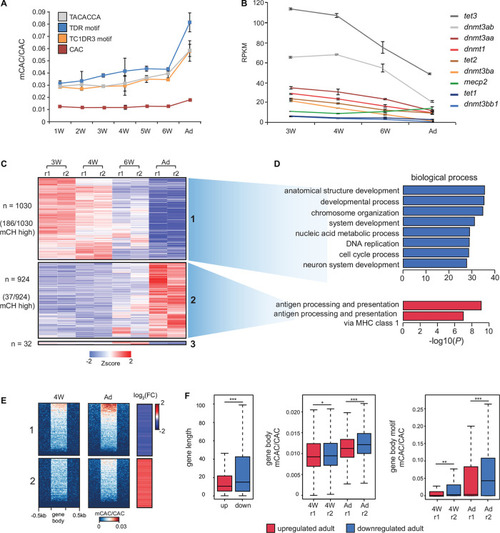
mCH accumulates in the developing nervous system. (A) mCAC/CAC levels at all CAC trinucleotides and top methylated CAC motifs in larval (W = weeks old) and adult (Ad) brains, as determined by RRBS. Data is represented as the average of two biological replicates with error bars (standard deviation). (B) RPKM (reads per kilobase per million) values of dnmt, tet, and mecp2 transcripts in larval and adult brains determined by RNA-seq. Data is represented as the average of two biological replicates with error bars (standard deviation). (C) Transcription intensities of a merged collection of differentially expressed genes called between all pairwise comparisons of larval and adult stages (r1—replicate 1, r2 = replicate 2). (D) Gene ontology enrichment of differentially expressed genes in larval and adult brains. (E) mCAC levels and relative RNA expression levels (log2 fold change 4W/Ad) at differentially expressed genes. (F) Comparisons of gene length (left), gene body mCAC/CAC (middle), and gene body mCAC/CAC at top methylated motifs (right) in genes that are either upregulated or downregulated in the adult brain (Wilcoxon test, P < 0.05, ∗∗P < 0.01, ∗∗∗P < 0.001).

Dnmt3a enzymes are required for methylation of CAC trinucleotides in the zebrafish brain. (A) Transcript levels of dnmt3aa and dnmt3ab in 4-week-old dnmt3aa/ab CRISPR/Cas9 KO (cKO) zebrafish brains relative to wild type (WT). The data is represented as the mean of technical replicates with error bars showing the standard error (two sample t-test, **P < 0.01). (B) Percentage of reads with no mutation, in-frame mutations, or frameshift mutations, which map to dnmt3aa and dnmt3ab loci in dnmt3aa/ab cKOs. (C) Average mCAC/CAC levels at all CAC trinucleotides and the top methylated CAC motifs in 4-week-old WT and dnmt3aa/ab cKO brain. The data is represented as the average of two WGBS biological replicates (Wilcoxon test, *P < 0.05, **P < 0.01, λ = unmethylated lambda spike in control). (D) mCAC/CAC levels of all gene bodies in 4-week-old WT and dnmt3aa/ab cKO brains. (E) Genome browser snapshot of mCAC/CAC levels in adult brains, 4-week-old WT brains and 4-week-old dnmt3aa/ab cKO brains.

Acknowledgments
This image is the copyrighted work of the attributed author or publisher, and ZFIN has permission only to display this image to its users. Additional permissions should be obtained from the applicable author or publisher of the image. Full text @ Front Cell Dev Biol