FIGURE SUMMARY
Title

HDL biodistribution and brain receptors in zebrafish, using HDLs as vectors for targeting endothelial cells and neural progenitors

Authors
Sulliman, N.C., Ghaddar, B., Gence, L., Patche, J., Rastegar, S., Meilhac, O., Diotel, N.
Source
Full text @ Sci. Rep.

HDL receptor mRNA expression in the whole brain and in the telencephalon of adult zebrafish. RNA sequencing data showing the relative levels of expression of HDL receptors in the whole zebrafish brain (n = 4) (A) and in the zebrafish telencephalon (n = 3) (B) of adult animals (data from Rodriguez-Vialez et al. 2015; Gourain et al. 2020; Wong and Godwin 2015)58,61,62. (C) qPCR analysis from 3 pools of 5 telencephala, providing the relative gene expression of HDL receptors in the telencephalon. RPKM reads per kilobase million.

HDL receptors are expressed in the brain parenchyma and along the periventricular zones. In situ hybridization of HDL receptors in the brain of adult zebrafish. The scheme provides the localization of the transversal section performed and the red square shows the regions where the high-magnification views were made. In situ hybridization in the medial zone of telencephalic area (Dm, AE), the posterior part of the preoptic area (PPp, FJ), the ventral zone of the periventricular hypothalamus (Hv, KO), around the lateral recess of the diencephalic ventricle (Lr, KO), the periventricular pretectal nucleus ventral part (PPv, PT), and the optic tectum (TeO, UY). Note that most HDL receptors are expressed in the brain parenchyma where neurons are localized and in periventricular zones where NSCs are localized. Scale bar = 50 μm.

Relationship between scarb1 expression and the distribution of radial glial cells. (A) Sagittal zebrafish brain view showing the respective transverse sections provided from B to H. (BH) The schemes adapted from the zebrafish brain atlas and from Menuet et al.70,71 illustrate the transverse brain section and the different brain regions/nuclei (left part), as well as the localization of radial glial cells (neural stem cells) along the brain ventricles (right part). In situ hybridization at the level of the telencephalon (B, C), the anterior and posterior preoptic area (C, D), the anterior, medial, and caudal hypothalamus (EG), as well as the medulla oblongata (H) demonstrate a wide scarb1 expression in the brain parenchyma and along the ventricular layer where radial glia reside (Black arrows). Scale bar = 50 μm.

Scarb1 is expressed in neurons and radial glial cells. Fluorescent scarb1 in situ hybridization in the medial zone of telencephalic area (AF) and in the caudal hypothalamus around the posterior recess of the diencephalic ventricle (GL).Scarb1 in situ hybridization (orange) is followed by Aromatase B (green) and HuC/D (red) immunohistochemistry to label NSCs and neurons, respectively. Note that scarb1 is expressed in both cell types. Scale bar = 50 μm.

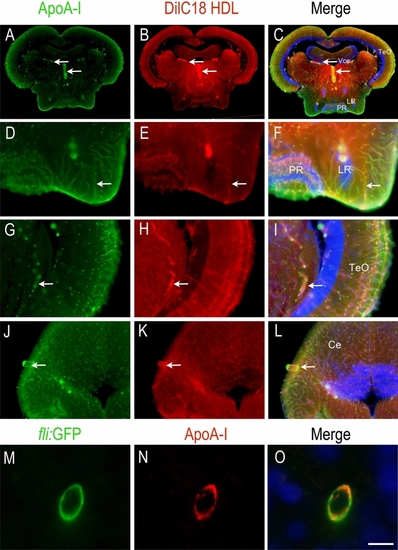
HDLs reach the brain microvasculature in zebrafish. ApoA-I immunohistochemistry (green) on zebrafish brain Sects. 1 h 30 min after intraperitoneal injection with 80 mg/kg of fluorescent HDL particles (red). Note that similar data were obtained with HDLs isolated from plasma (plHDL, n = 3) and with reconstituted HDLs (rHDL, n = 7). (AL) ApoA-I staining (green) colocalizes with fluorescent HDLs (red) as clearly evidenced by the merged pictures and revealed blood vessel staining. (MO) Confocal imaging of a transverse brain section from a Tg(fli1:EGFP) zebrafish expressing GFP in the endothelial cells from blood vessels54. Note ApoA-I staining (red) detection in endothelial cells (green). The merge pictures (C, F, I, L, O) also show cell nuclei using DAPI counterstaining (blue). Scale bar = 50 μm.

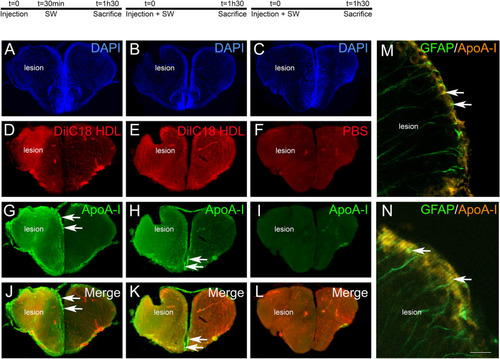
HDLs are taken up by the lesioned hemisphere after stab wound injury in zebrafish. ApoA-I immunohistochemistry (green) on injured zebrafish brain following intraperitoneal injection with 80 mg/kg of red fluorescent reconstituted HDLs (n = 8) or PBS (n = 6) as control. The design of the experiment is presented at the top of the figure. (AL) Note that red fluorescence (HDL) and ApoA-I staining (green) are localized within the brain parenchyma of the injured hemisphere, while HDLs are clearly located in the cerebral vasculature in the contralateral (uninjured) hemisphere. The arrows indicate ApoA-I staining in ventricular cells, probably corresponding to NSCs. In PBS-injected fish (n = 3), ApoA-I immunohistochemistry did not provide any staining, demonstrating the specificity of the labeling. (MN) ApoA-I immunohistochemistry on GFAP::GFP transgenic fish55 injected with HDLs immediately after the lesion. The arrows show GFAP-positive NSCs co-labeled with ApoA-I. Scale bar = 200 μm (AH) and 20 μm (I, J).

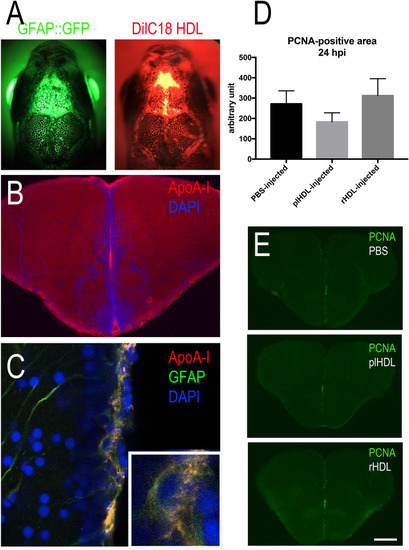
Intracerebroventricular injection of HDLs results in their uptake by neural stem cells but did not modify their proliferation. (A) Overview pictures of GFAP::GFP (green) zebrafish heads following injection with fluorescent HDLs (red). Note the diffusion of HDLs in the telencephalic ventricle. (B) ApoA-I immunohistochemistry 3 hpi showing ApoA-I detection in the ventricular cavity and the ventricular zone. (C) ApoA-I immunohistochemistry showing ApoA-I detection (yellow) in GFAP::GFP-positive radial glial cells (NSCs in green) with DAPI cell nuclear counterstaining (blue). (D) PCNA-positive area quantification following PBS, plasmatic HDL (plHDL), and reconstituted HDL (rHDL) 24 h intracerebrovascular post-injection (n = 4–6 injected fish). No significant differences were observed between the groups. (E) Representative pictures of PCNA immunostaining 24 h post-injection with PBS, plasmatic HDL (plHDL), reconstituted HDL (rHDL). Scale bar = 800 μm (A), 150 μm (B), 21 μm (C), and 200 μm (E).

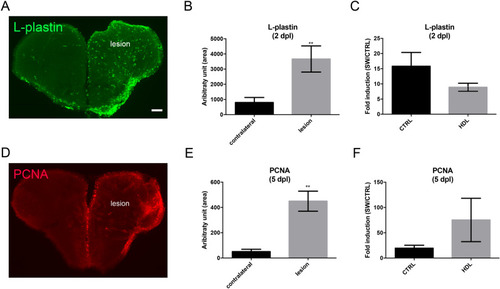
HDL injection did not impact microglia recruitment and injury-induced proliferation at the ventricular zone after telencephalic injury. Zebrafish underwent stab wound injury of the telencephalon and were injected with 80 mg/kg of plasma HDL (n = 9) or PBS as a control (n = 10) and sacrificed at 2- or 5-days post lesion (dpl). (A) l-Plastin immunohistochemistry (green) showing increased microglial recruitment in the injured telencephalon at 2 dpl. (B) Quantification of the l-Plastin-positive area in the contralateral and injured hemisphere in PBS-injected fish, demonstrating significant upregulation of microglia recruitment following brain injury at 2 dpl. (C) l-Plastin fold induction between lesioned and non-lesioned hemispheres in HDL and PBS-injected fish at 2 dpl. (D) PCNA immunohistochemistry (red) showing increased ventricular proliferation in the injured telencephalon at 5 dpl. (E) Quantification of the PCNA-positive area in the contralateral and injured hemisphere in PBS-injected fish, demonstrating a significant upregulation of proliferation following brain injury at 5 dpl. (F) PCNA fold induction between lesioned and non-lesioned hemispheres in HDL and PBS injected fish at 5 dpl. **p < 0.01. Scale bar = 100 μm.

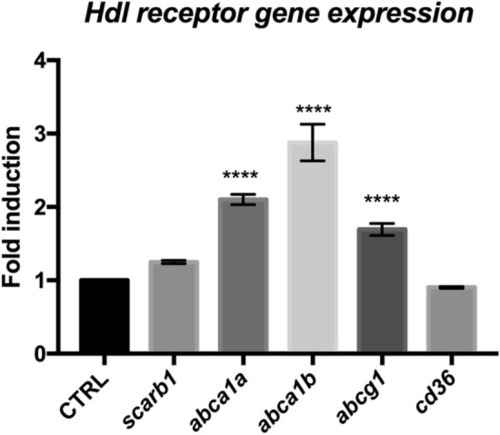
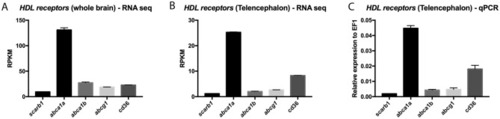
HDL receptors are upregulated at 5 days post brain injury. Reanalysis of the RNA sequencing data set from zebrafish of injured and uninjured telencephalon at 5 days post-lesions (data from58,61). ****p < 0.001.

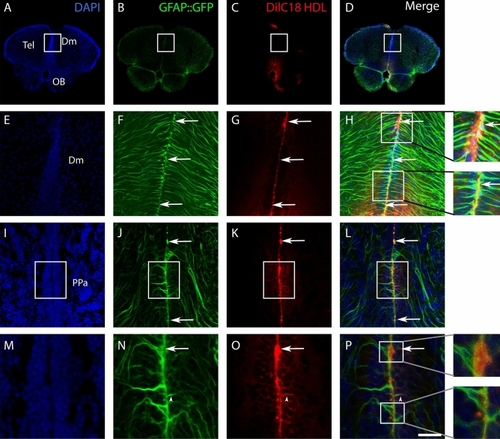
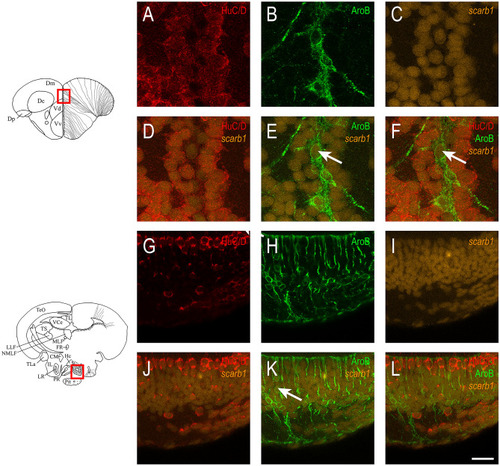
Delivery of DilC18 dye in GFAP::GFP-positive neural stem cells mediated by HDL intracerebroventricular injection. Three adult transgenic zebrafish (GFAP::GFP) were intracerebroventricularly injected with HDLs in which DilC18 dye was incorporated (fish were allowed to survive for 1 h 30 min). (AD, IL) Zebrafish brain sections at the junction through the olfactory bulbs (OB)/telencephalon (Tel) and through the anterior part of the preoptic area (PPa), showing DilC18 dye (red) along the ventricular layer where NSCs (green) are located. Note the uptake of the DilC18 dye (red) by NSCs (green) as shown by the yellow color in the merged pictures (see arrows). (EH, MP) Higher magnifications of the white boxes in (AD, IL), respectively. The arrows show colocalization of the dye with GFP, and arrowheads show the colocalization in neural stem cell processes. Scale bar = 700 μm (A, B), 140 μm (EH), 85 μm (IL), and 40 μm (MP).

Acknowledgments
This image is the copyrighted work of the attributed author or publisher, and ZFIN has permission only to display this image to its users. Additional permissions should be obtained from the applicable author or publisher of the image. Full text @ Sci. Rep.