
- Title
-
Ciliary rootlet coiled-coil 2 (crocc2) is associated with evolutionary divergence and plasticity of cichlid jaw shape
- Authors
- Gilbert, M.C., Tetrault, E., Packard, M., Navon, D., Albertson, R.C.
- Source
- Full text @ Mol Bio Evol
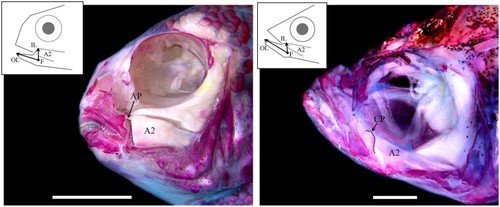
Functional anatomy of the cichlid and zebrafish head. A dissected and alizarin red stained head of a representative cichlid, |
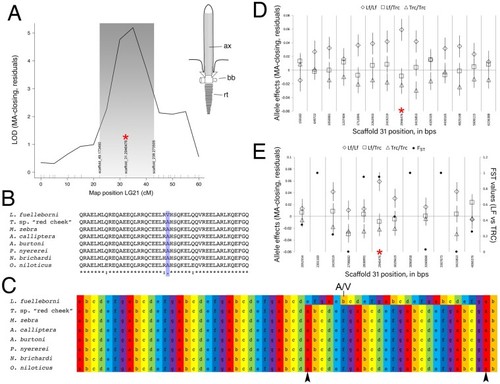
Mapping of lower jaw mechanical advantage in cichlids. The QTL for relative height of the articular process (i.e., mechanical advantage of jaw closing, “MA-closing”) maps to LG21 and peaks over a marker on physical scaffold number 31 ( |
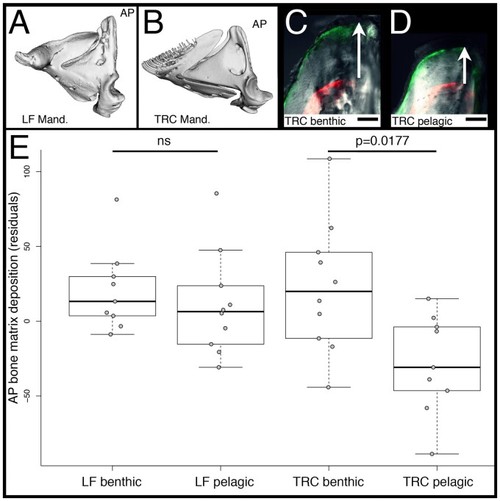
Rates of bone matrix deposition in cichlids. Mandibles of LF ( |
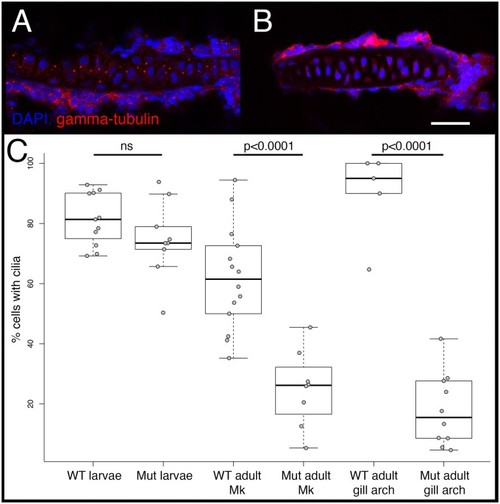
Cilia number in WT and mutant zebrafish. Cilia were visualized via immunohistochemistry using either anti-gamma-tubulin (shown), which labels the basal bodies, or anti-alpha acetylated-tubulin (not shown), which labels the axoneme, and imaged via confocal microscopy. Representative images are shown for the gill arch cartilage in WT ( PHENOTYPE:
|
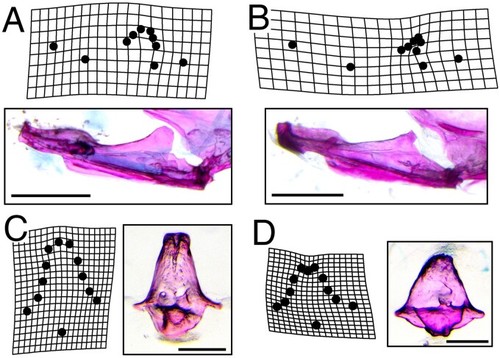
Dysmorphic bone geometry in PHENOTYPE:
|
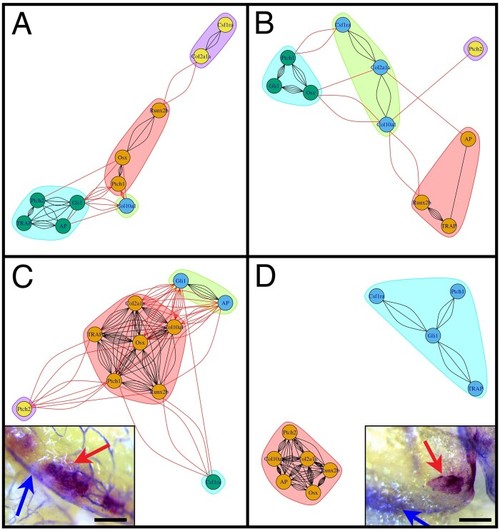
Mis-regulation of the bone marker gene expression in |

Rates of bone matrix deposition do not respond to environmental stimuli in PHENOTYPE:
|