FIGURE SUMMARY
Title

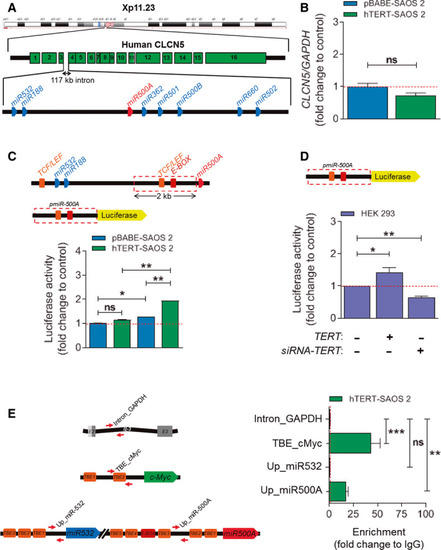
Telomerase reverse transcriptase (TERT) activates transcription of miR500A to inhibit Hedgehog signaling and promote cell invasiveness

Authors
Bernabé-García, M., Martínez-Balsalobre, E., García-Moreno, D., García-Castillo, J., Revilla-Nuin, B., Blanco-Alcaina, E., Mulero, V., Alcaraz-Pérez, F., Cayuela, M.L.
Source
Full text @ Mol. Oncol.

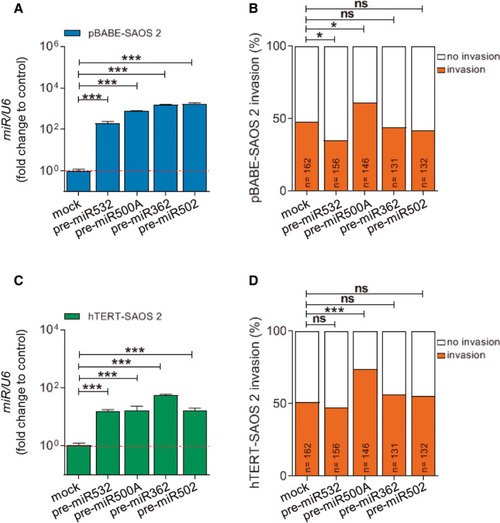
TERT up-regulates the expression of miR500A, leading to an increase in the in vivo invasive capacity. (A) Quantification of the in vivo invasive capacity and (B) proliferation rate of SAOS 2 cells. (C) Quantification of miR500A levels in TERT overexpression conditions by real-time RT-qPCR. (D-G) Overexpression and inhibition of miR500A by transient transfection with the pre-miR500A (D, E) or with an anti-miR500A PNA probe (F, G), respectively, in both pBABE- and hTERT-SAOS 2 cells. (D, F) Quantification of miR500A level and (E, G) its effect on the in vivo invasive capacity. In (C, D, F), each bar represents the mean ± SEM from triplicate samples. In (A, E, G), histogram represents the accumulative value of the invasion percentage of the number of larvae stated in the figure for each treatment. Graphs are representative of three (N = 3) (C, D, F). ns, not significant; *P < 0.05; **P < 0.01; ***P < 0.001 according to Student's t-test (C), ANOVA followed by Tukey's multiple comparison test (D, F) and Fisher's exact test (A, E, G).

TERT regulates miR500A by directly binding to its promoter region. (A) Schematic representation of the miR500 cluster according to the Ensembl database. Names are shortened to simplify. (B) Quantification of CLCN5 mRNA levels in TERT overexpression conditions by real‐time RT‐qPCR. (C) miR500A promoter activity in TERT overexpression conditions and (D) in TERT‐depleted HEK293 cells by luciferase reporter assay. (E) Determination of the promoter occupancy by amplification using a ChIP assay in hTERT‐SAOS 2 cells. The schemes represent the primers mapping to both negative (intron_GAPDH) and positive (TBE_cMyc) controls, and to the miR500 cluster. Each bar represents the mean ± SEM from triplicate samples. Graphs are representative (B, E) or the average (C, D) of three (N = 3) (B‐D) or two (N = 2) (E) independent experiments. ns, not significant; *P < 0.05; **P < 0.01; ***P < 0.001 according to Student's t‐test (B, C) and ANOVA followed by Dunnett's multiple comparison test (D, E).

The miR500 cluster is regulated by TERT. (A) Schematic representation of the miR500 cluster. (C–G) Quantification of the mRNA levels of five different miRNAs from the miR500 cluster under TERT overexpression conditions (B) by real‐time RT‐qPCR. Each bar represents the mean ± SEM from triplicate samples, and graphs are representative of three different experiments (N = 3). ND, not determined; ns, not significant; *P < 0.05; **P < 0.01 according to Student's t‐test.

Only the miR500A is able to increase the invasiveness. Contribution of the different miRNAs from the miR500 cluster to the in vivo invasion capacity of pBABE‐SAOS 2 (A, B) and hTERT‐SAOS 2 (C, D) cells. In (A, C), each bar represents the mean ± SEM from triplicate samples. In (B, D), histograms represent the accumulative value of invasion percentage of the number of larvae stated in the figure for each treatment. Graphs are representative (A, C). ns, not significant; *P < 0.05; ***P < 0.001 according to ANOVA followed by Dunnett's multiple comparison test (A, C) and Fisher's exact test (B, D).

Telomerase activity is not involved in miR500A up‐regulation by TERT. (A–D) Transfection of pBABE‐SAOS 2 cells with TERT or DN‐TERT (protein levels showed and quantified in (A)) to determine whether telomerase activity is necessary for miR500A promoter activity (B), for TERT‐dependent miR500A expression (C) and for the in vivo invasive capacity (D). (E, F) Inhibition by specific chemicals of TERC and TERT subunits in hTERT‐SAOS 2 cell line and its effect on the levels of miR500A (E) and on the in vivo invasive capacity (F). Each bar represents the mean ± SEM from triplicate samples, and graphs are representative of two (N = 2) (A) or three (N = 3) (B, C, E) independent experiments. Histograms represent the accumulated value of invasion percentage of a total of larvae stated in the figure for each treatment. ND, not determined; ns, not significant; *P < 0.05; **P < 0.01; ***P < 0.001 according to ANOVA followed by Dunnett's (A), Tukey's (B, C, E), multiple comparison test and Fisher's exact test (D, F)

The Hedgehog signalling pathway is regulated by miR500A. (A‐C) Quantification of the mRNA levels of PTCH1 (A), GLI3 (B) and CUL3 (C) by real‐time RT‐qPCR in TERT overexpression conditions. (D) Luciferase activity following cotransfection with pre‐miR500A, in combination with the indicated PTCH1 3′UTR constructs in cells. (E, F) Specific inhibition of PTCH1 by siRNA in pBABE‐SAOS 2 cells. (E) Quantification of PTCH1 level and (F) its effect on the in vivo invasive capacity. (G, H). Correlations between TERT vs miR500A, and miR500A vs PTCH1 expression are shown in invasive STAC (G) and BLCA (H). Spearman's correlation (G, H) reveals a statistically significant positive correlation between TERT and miR500A, and a statistically significant negative correlation between miR500A and PTCH1. Each bar represents the mean ± SEM from triplicate samples, and graphs are the mean of three (N = 3) independent experiments (A–E). Histogram represents the accumulative value of the invasion percentage of the number of larvae stated in the figure for each treatment (F). ns, not significant; *P < 0.05; ***P < 0.001 according to Student's t‐test (A–C, E) and ANOVA followed by Bonferroni's multiple comparison test (D) and Fisher's exact test (F).

Extracurricular mechanism of TERT during invasion and tumour progression as seen by regulating miR500A. (I) Telomerase expression is reactivated in most tumours, and (II) TERT binds directly to the TBE sequences located at the promoter region of miR500A, resulting in the up‐regulation of miR500A and also the miRNAs located downstream of miR500A. As a compensatory mechanism, this regulation is fine‐tuned by the miR532, which acts as a negative regulator by repressing the hTERT mRNA. (III) The oncomiR miR500A represses post‐transcriptionally the mRNA of the tumour suppressor PTCH1, triggering a ligand‐independent aberrant Hedgehog signalling activation (IV) that contributes significantly to increase the invasiveness of tumour cells. (V) The chemical inhibition of TERT with BIBR 1532 could be a new strategy to fight cancer.

Acknowledgments
This image is the copyrighted work of the attributed author or publisher, and ZFIN has permission only to display this image to its users. Additional permissions should be obtained from the applicable author or publisher of the image. Full text @ Mol. Oncol.