
- Title
-
Improving the sexual activity and reproduction of female zebrafish with high testosterone levels
- Authors
- Liu, C., Yue, S., Solarz, J., Lee, J., Li, L.
- Source
- Full text @ Sci. Rep.
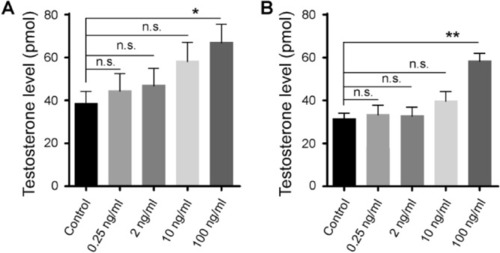
Testosterone levels in isolated ovary ( PHENOTYPE:
|
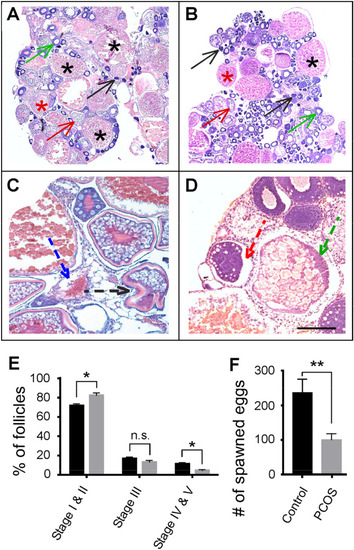
Follicle development and ovulation in control and PCOS zebrafish. (A,B) Histological sections of the ovary. In control fish (A), follicles at different stages could be identified. These include developing follicles (Stages I and II, black and green arrows), transitioning follicles (Stage III, red arrows), and mature follicles (Stages IV and V, red and black asterisks). In PCOS fish (B), more developing follicles but less mature follicles were observed. (C,D) Histological sections that show abnormal follicles in PCOS fish. These include zona pellucida invagination (black arrow), theca hypertrophy/granulosa cell invagination (blue arrow), basal membrane disintegration (red arrow), and basophilic granular accumulation (green arrow). Scale bar: 100 µm in panels (A) and (B), and 50 µm in panels (C) and (D). (E) Percentage of developing, transitioning, and mature follicles in control (black bars) and PCOS fish (grey bars). Note the increase of developing follicles and the decrease of mature follicles in PCOS animals. (F) Ovulation in control (black bar) and PCOS (grey bar) zebrafish. Note the decrease of ovulation in PCOS fish. Data represents the means ± SE (n = 8 in each group). *p < 0.05; **p < 0.01; ns not significant. PHENOTYPE:
|
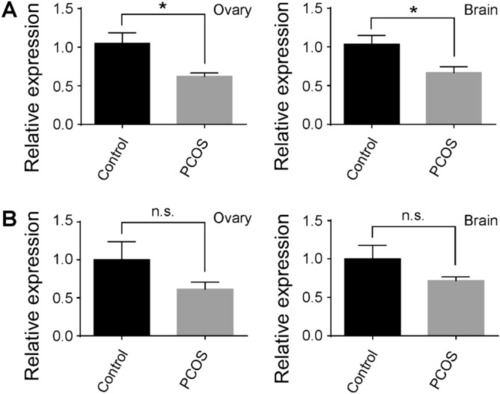
The expression of Tox3 (A) and Dennd1a (B) in isolated ovary and brain tissues from the control (black bars) and PCOS (grey bars) animals. The expression of Tox3 and Dennd1a in the control sample was normalized to 1, and their expression in PCOS fish was compared to the base value of 1. Note the decrease of Tox3 expression in PCOS samples. However, no significant changes in Dennd1a expression were detected. Data represents the means ± SE (n = 8 in each group). *p < 0.05; ns not significant. |
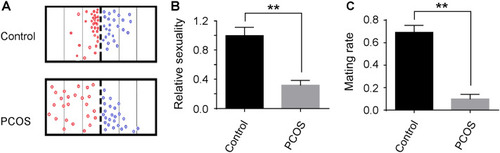
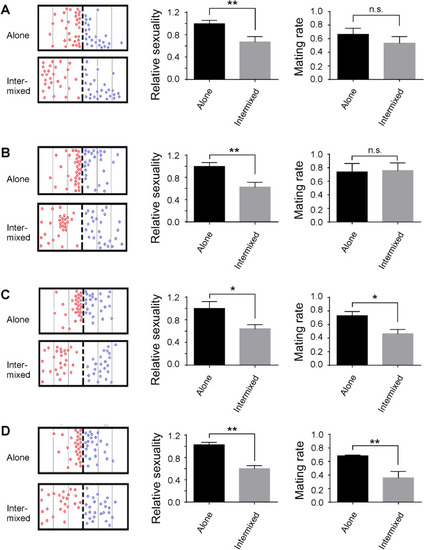
Swimming patterns, sexuality scores, and mating rates of control and PCOS zebrafish. ( PHENOTYPE:
|
Swimming patterns, sexuality levels, and mating rates of PCOS zebrafish after 3 days ( |