
- Title
-
Chemokine-biased robust self-organizing polarization of migrating cells in vivo
- Authors
- Olguin-Olguin, A., Aalto, A., Maugis, B., Boquet-Pujadas, A., Hoffmann, D., Ermlich, L., Betz, T., Gov, N.S., Reichman-Fried, M., Raz, E.
- Source
- Full text @ Proc. Natl. Acad. Sci. USA

Polarized distribution of proteins and subcellular structures within wild-type migrating PGCs and steps of self-organized ligand-independent polarized bleb formation. (A–G) The localization fluorescent protein fusions (green) labeling (A) actin (Lifeact), (B) the ER (calreticulin signal peptide), (C) the MTs (Clip-170H protein), (D) the Golgi (N terminus of beta 1,4-galactosyltransferase fusion), (E) Ezrin, (F) extended synaptotagmin-like 2a (Esyt2a) and (G) Septin9a, relative to the plasma membrane (labeled by a farnesylation signal from c-Ha-Ras fused to fluorescent protein [magenta]) and the nucleus (magenta in C and D). White arrows indicate the direction of migration. (Scale bars, 10 µm.) (H) The formation of membrane invaginations labeled with the N-BAR domain (human Amphiphysin fused to YFP [green]), at the new front where Lifeact-labeled actin accumulates (magenta). Times are in minutes and seconds. (Scale bar, 10 µm.) (I) The formation of actin brushes at the new front and inflation of the first bleb. Times are in minutes and seconds. (Scale bar, 5 µm.) (J) The time of bleb formation relative to the time of establishment of actin brushes at the cell front (median, 5 and 95 percentiles are indicated. n = number of cells, time is in seconds). |
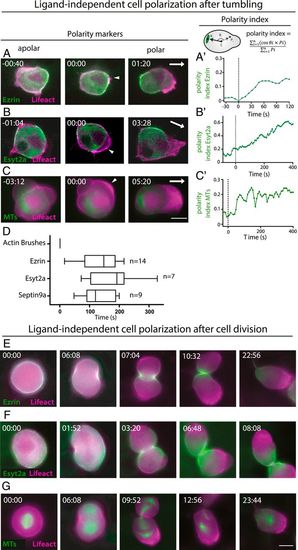
Steps of ligand independent self-organizing cell polarization. (A–C) The establishment of the cell rear in the absence of receptor signaling as determined by the distribution of (A) Ezrin, (B) Esyt2a, and (C) MTs (Clip170H) in green. The cell front is marked by Lifeact (magenta). Apolar tumbling cells (Left), the appearance of actin within the new cell front (time 00:00, Middle), and the localization of the proteins at the rear of the cell (Right) is presented. Times indicate minutes and seconds, before and after the establishment of the front and the white arrows point at the direction of migration. The arrowheads indicate the actin brushes. (Scale bar, 10 µm.) (A′–C′) Time course of the polarity index establishment of the polarization of Ezrin (A′), Esyt2a (B′), or MTs (C′) within the cells presented in A–C. In A′ and B′ the signal was measured only at the level of the membrane; time appears in seconds. (D) Time of ligand-independent polarization of the rear markers relative to the time of actin accumulation at the cell front (time 0) (median, 5 and 95 percentiles are presented, n = number of cells, time is in seconds). (E–G) Establishment of polarity following cell division. Lifeact presented in magenta and the rear markers in green: (E) Ezrin, (F) Esyt2a, and (G) MTs. Apolar cells prior to cytokinesis (Left) and subsequent panels present the progression through cell division, with the polarized daughter cell (Right). (Scale bar, 10 µm.) |

The role of actin brushes and Rac1 GTPase in the establishment of the self-organizing ligand-independent polarization of PGCs. (A) Polarization of PAK-1 GBD (green), marking locations where Rac1 is active. Dashed line indicates the PAK-1 GBD crescent (Left). Actin brushes (magenta) form at the newly established PAK-1 GBD marked front. (B, B′) Light induced Rac1 activation is sufficient for directing polarization in tumbling PGCs (B) and for reversing polarity in already polarized cells (B′). Lifeact is presented in magenta and Esyt2a and Ezrin fusion proteins are in green. Blue circles indicate the area where the light-activated Rac1 was activated. (C) Rac1 activity is required for polarity establishment as judged by lack of stable focused accumulation of Lifeact (Left, magenta), Ezrin (Middle, green), and MTs (Right, green, CLIP-170) in cells expressing dominant negative Rac1 (DN-Rac1). Graphs show the polarity index of Ezrin (Left graph) and the MTs (Right graph). (D) Invasion of ER into front and back blebs. n = 140 front blebs and 29 back blebs in 16 cells. (D′, D″) Wild-type PGCs labeled with Lifeact (blue), ER (green), and cytoplasm (red). The blebs are marked by the dashed line. The asterisk indicates the front bleb and the arrowhead points at a bleb formed at the back. (Scale bars, 10 µm.) Time is in minutes and seconds and white arrows indicate the direction of migration. |

The role of contractility and of Ezrin function in ligand-independent self-organized polarization of PGCs. (A) Intracellular flow fields of cytoplasm and Esyt2a during PGC migration in wild-type embryos, measured using Bioflow software. White arrow indicates the direction of migration. (B) ROCK activity is required for the establishment of the rear. Lifeact is in magenta and Ezrin (Left), Esyt2a (Middle), and MTs (Clip170H, Right) are in green in cells expressing a DN-ROCK. (C) Enhanced contractility induced by expression of a constitutively active RhoA (CA-RhoA) results in hyperpolarization of the cell. Lifeact is in magenta and Ezrin (Left), Esyt2a, (Middle), and MTs (Clip170H, Right) are in green. Dashed line marks the contours of the cell front. (D) Hyperactive version of Ezrin (amino acids 1 to 583) is distributed over a larger portion of the cell perimeter (Left, Lifeact in magenta and Ezrin in green) and inhibits blebbing activity (graph on the Right, Ezrin (1 to 583) n is the number of cells, two-tailed t test with Welch’s correction, P = <0.0001). (Scale bars, 10 µm.) |
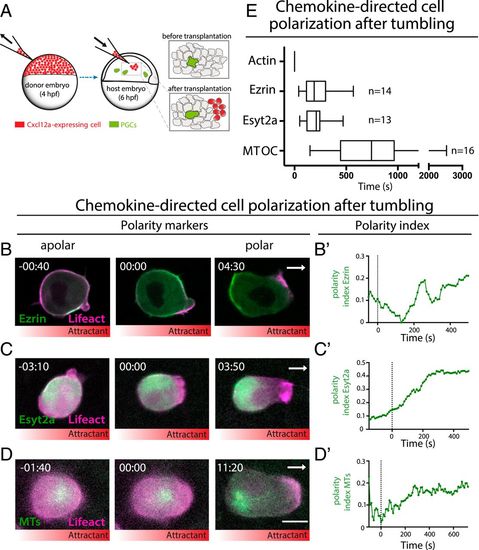
Chemokine-directed polarity establishment. (A) A scheme presenting the generation of local chemokine source within the live embryo. (B–D) Apolar cells (Left), the emergence of the polarized front (time 00:00) (Middle), and the subsequent polarized localization of the rear markers (Right). Lifeact is labeled with magenta and rear markers (B) Ezrin, (C) Esyt2a, and (D) MTs (Clip170H) are in green. White arrows indicate the direction of migration toward the chemokine source. Time is in minutes and seconds. (Scale bar, 10 µm.) (B′–D′) Time course of polarity index establishment during cell polarization; time is in seconds. For B′ and C′ the signal was measured only at the level of the membrane. In B–D the distribution of the chemokine (Cxcl12a) is illustrated by the red gradient below the panels. (E) Timing of the chemokine induced polarization steps relative to the time of actin localization at the cell front (time 0) (median, 5 and 95 percentiles are presented, n = number of cells, time in seconds). |

Mechanism of chemokine-induced polarization. (A) Rac1 activity is required for ligand-induced polarity establishment. Localization of Ezrin (green, Upper), Esyt2a (green, second panel), MTs (green, third panel), and Lifeact (magenta, Lower) in DN-Rac1-expressing PGCs in the presence of a chemokine gradient. Graphs show the polarity index of Ezrin (Upper), Esyt2a (Middle), and the MTs (Lower). (B) Localization of Ezrin (green, Left), Esyt2a (green, Middle), and MTs (green, Right) in DN-ROCK-expressing PGCs in the presence of a chemokine gradient. Lifeact is marked in magenta. Inhibition of contractility by DN-ROCK affects the definition of the cell rear in these cells. (C) Enhancement of contractility by expression of a constitutively active RhoA (CA-RhoA) in the presence of the chemokine gradient with Lifeact (magenta) and Ezrin (Left), Esyt2a (Middle), and MTs (Right) in green. (D) The angle of protrusions relative to the position of the attractant source in wild-type cells (Left, n = 72), and in PGCs with increased contractility (Right, n = 50). In the rose plot, 0° indicates the source of the chemokine. (E and E′) Cxcr4b expression in control (E) and CA-RhoA-expressing cells (E′). The plasma membrane is labeled with a farnesylation signal and Cxcr4b is an in-frame fusion with GFP (z-projection). In A–D the distribution of the chemokine (Cxcl12a) is illustrated by the gradient in the red rectangle. (Scale bars, 10 µm.) |
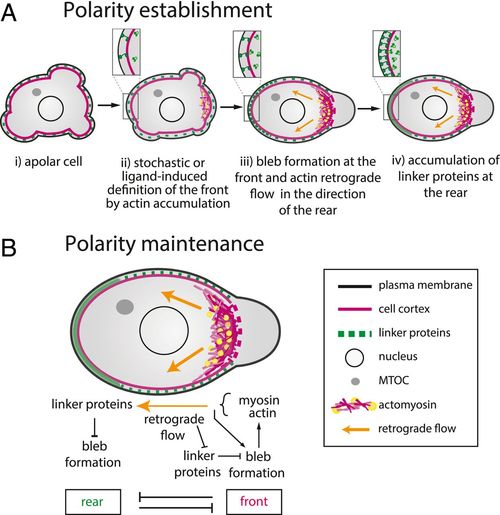
A model for polarity establishment and maintenance in migrating PGCs. (A) The exit from the apolar state (i) can either be in a random direction, or biased by the polar distribution of the guidance cue. As judged by the site of actin polymerization, the cell front is defined first (ii). Actin accumulation at the front focuses the protrusions to the same location and actomyosin-dependent retrograde flow leads to progressive increase in the amount of the linker proteins (Ezrin and Esyt2a, green) and the Septin9a protein at the rear (iii). In the fully polarized cell, high levels of linker proteins are found at the cell rear (iv). (B) Polarity is maintained by the enhanced contractility at the cell front that promotes bleb formation at the front and flow of bleb-inhibiting linker proteins to the rear, where they inhibit bleb formation. |