
- Title
-
Spinal cord precursors utilize neural crest cell mechanisms to generate hybrid peripheral myelinating glia
- Authors
- Fontenas, L., Kucenas, S.
- Source
- Full text @ Elife
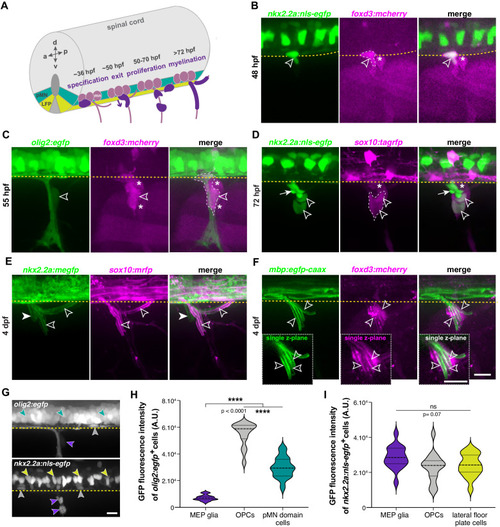
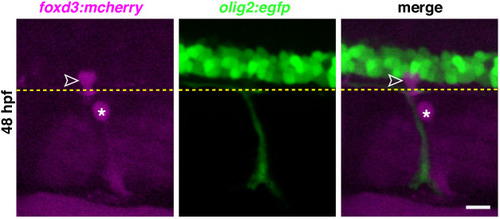
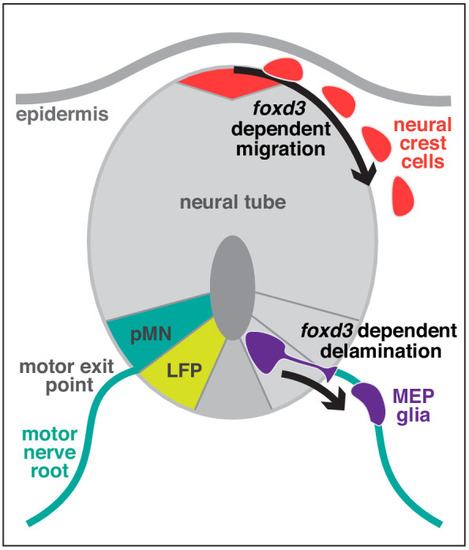
(A) Timeline of MEP glial development. MEP glia (purple) are specified in the ventral spinal cord (gray) after 36 hpf, exit through motor exit points at ~50 hpf, divide, and migrate to eventually initiate myelination of motor root axons (pink) starting at 72 hpf. mn: motorneuron, LFP: lateral floor plate. (B–F) Lateral views of the motor exit point showing (B) a nkx2.2a+/foxd3+ MEP glia (outlined arrowhead) exiting the spinal cord at the motor exit point at 48 hr post-fertilization (hpf); (C) an olig2+/foxd3+ MEP glia (outlined arrowhead) along motor nerve root axons at 55 hpf; (D) sox10+/nkx2.2a+ MEP glia (outlined arrowheads) and sox10-/nkx2.2a+ perineurial glia (arrow) at 72 hpf; (E) sox10+/nkx2.2a- MEP glial sheaths (outlined arrowheads) and sox10+/nkx2.2a+ perineurial cells at 4 days post-fertilization dp (arrowhead) and (F) foxd3+ MEP glia making mbp+ myelin sheaths (outlined arrowheads) at 4 dpf. Insets show single z-plane images. (G) In olig2:egfp and nkx2.2a:nls-egfp larvae at 55 hpf, olig2+ pMN domain cells (teal), OPCs (gray), and MEP glia (purple) are labeled, as are nkx2.2a+ LFP cells (yellow), OPCs (gray) and MEP glia (purple). These images were used for fluorescence intensity measurement. (H) Violin plot of mean intensity of GFP fluorescence of olig2:egfp+ cells at 55 hpf (OPCs: 54914 ± 1674 arbitrary units (A.U.), MEP glia: 7149 ± 394, pMN domain cells: 29934 ± 1481). (I) Violin plot of mean intensity of GFP fluorescence of nkx2.2a:nls- egfp cells at 55 hpf (OPCs: 22981 ± 2013, MEP glia: 28610 ± 1624, lateral floor plate cells: 24049 ± 1602). (H–I) (n = 28 MEP glia, n = 28 OPCs and n = 28 neural tube cells from seven embryos). Asterisks denote the dorsal root ganglion (DRG) and yellow dashed lines denote the edge of the spinal cord. Scale bar (B–G) 20 µm. |
( |
( |
All sections were collected along the yolk extension. White dashed lines show the dorsal edge of the lateral floor plate and yellow dashed lines denote the edge of the spinal cord. Scale bar, 25 µm. |
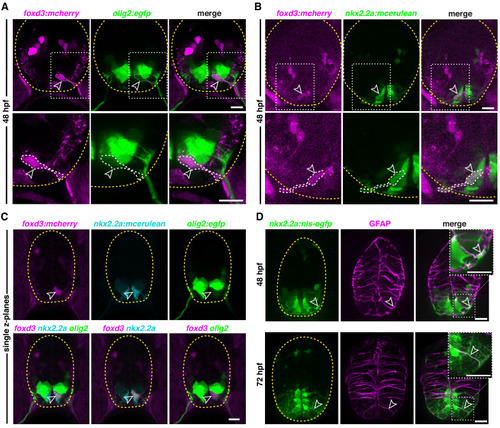
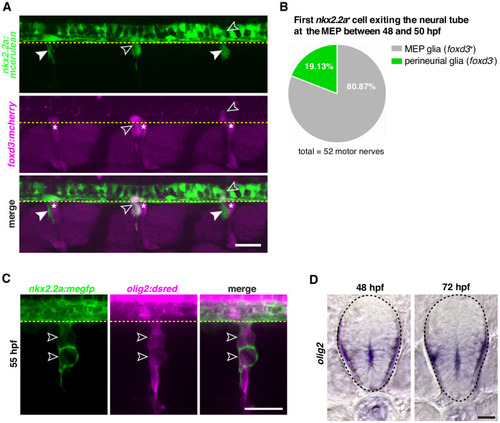
(A) Transverse section of a foxd3:mcherry;olig2:egfp embryo at 48 hpf showing a foxd3+/olig2+ MEP glial cell (outlined arrowhead) ventral to the olig2 pMN domain in the spinal cord. (B) Transverse section of a foxd3:mcherry;nkx2.2a:mcerulean embryo at 48 hpf showing a foxd3+/nkx2.2a+ MEP glial cell (outlined arrowhead). (C) Transverse section of a foxd3:mcherry;nkx2.2a:mcerulean;olig2:egfp embryo at 48 hpf showing a foxd3+/nkx2.2a+/olig2+ triple positive MEP glial cell (outlined arrowhead) in the p3 domain of the neural tube, just ventral to the pMN domain. (D) Transverse section of a nkx2.2a:nls-egfp embryo showing nkx2.2a+/GFAP+ radial glia (outlined arrowhead) at 48 hpf (top panel) and 72 hpf (bottom panel). Yellow dashed lines outline the edge of the spinal cord. Top right corner white boxes show higher magnification of bottom white boxes. Scale bar, (A–D) 10 µm. |
Yellow dashed lines denote the edge of the spinal cord and asterisks denote the DRG. Scale bar, 10 µm. |
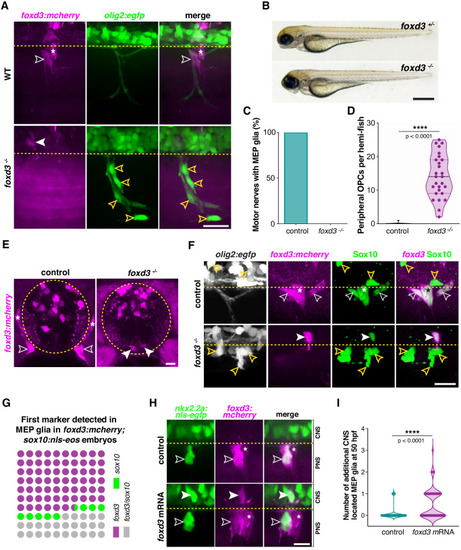
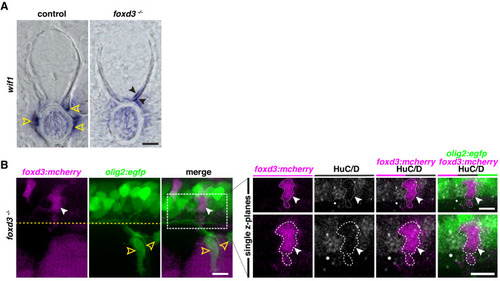
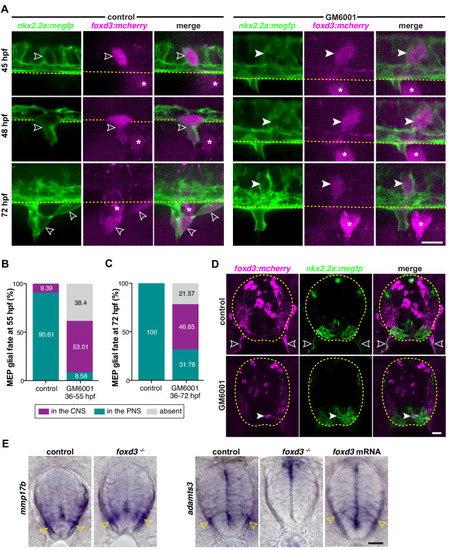
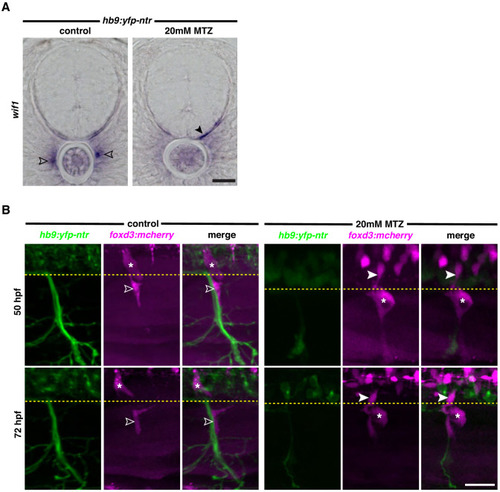
(A) MEP TZ in a foxd3:mcherry;olig2:egfp larvae showing foxd3+ MEP glia (white outlined arrowhead) along the motor root of a foxd3+/- control larva and stalled in the spinal cord of a foxd3-/- larva (white arrowhead) at 3 dpf. Note the presence of peripheral OPCs (yellow outlined arrowheads) along motor nerve axons in a foxd3-/- sibling lacking peripheral MEP glia. (B) Bright-field images of foxd3+/- and foxd3-/- siblings at 3 dpf reveal no developmental delay in foxd3-/- larvae. (C) Percentage of motor nerves with MEP glia in foxd3+/- (n = 150 nerves from 10 larvae) and foxd3-/- siblings (n = 270 nerves from 27 larvae) at 3 dpf. (D) Mean ± SEM of peripheral OPCs in olig2:egfp;foxd3:mcherry;foxd3+/- (0.07 ± 0.07, n = 15 larvae) and foxd3-/- (14.07 ± 1.2, n = 27 larvae) larvae at 3 dpf; p<0.0001. (E) Transverse sections of the spinal cord in foxd3:mcherry;foxd3+/- and foxd3-/- larvae showing MEP glia (outlined arrowheads) at the motor nerve root in a control sibling and MEP glia (arrowheads) in the lateral floor plate in a foxd3 mutant at 72 hpf. (F) Immunohistochemistry showing Sox10+/foxd3+ MEP glia (white outlined arrowheads) along motor nerve root axons in a foxd3+/- control embryo, and a Sox10+/foxd3+ MEP glial cell (white arrowhead) stalled in the spinal cord of a foxd3-/- larvae at 3 dpf. Yellow outlined arrowheads show OPCs in the spinal cord in a control larva and along peripheral axons in a foxd3-/- larva. Asterisks denote the DRG in control larvae. Note the absence of DRG in foxd3 mutants. (G) Dot plot of markers first detected in MEP glia, in percent. (H) Control and foxd3 mRNA-injected nkx2.2a:nls-egfp;foxd3:mcherry embryos showing a nkx2.2a+/foxd3+ MEP glia (outlined arrowhead) in the PNS in a control embryo and nkx2.2a+/foxd3+ MEP glia both in the CNS (arrowhead) and PNS (outlined arrowhead) in the injected embryo, at 50 hpf. (I), Mean ± SEM of additional CNS-located MEP glia indicates 0.08 ± 0.03 MEP glia in control embryos (n = 76 hemi-segments from 10 embryos), and 0.54 ± 0.07 MEP glia in foxd3 mRNA injected embryos (n = 78 hemi-segments from 10 embryos) at 50 hpf; p<0.0001. Asterisks denote the DRG and yellow dashed lines denote the edge of the spinal cord. Scale bar, (A, F) 25 µm, (B) 0.5 mm, (E) 10 µm, and (H) 20 µm. |
( |
|
( |
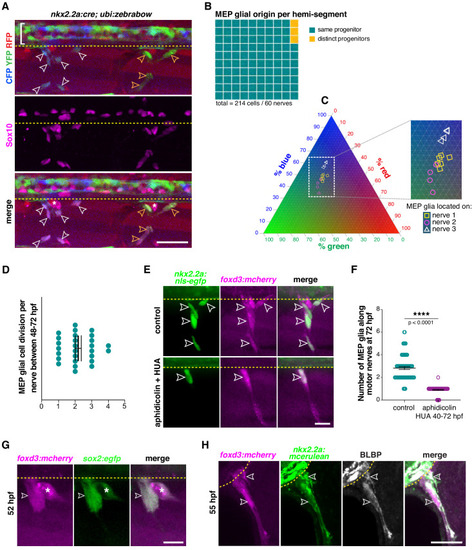
(A) Lateral view of Sox10 immunohistochemistry in a nkx2.2a:cre;ubi:zebrabow larvae showing Cre recombinase driven recombination (blue and green) in nkx2.2a+ cells at 4 dpf. Floor plate cells (bracket) and Sox10+ MEP glia along two distinct nerves (white and yellow outlined arrowheads respectively) labeled. (B) Percentage of MEP glia present along a single motor nerve sharing a common (96.67%) vs distinct neural tube precursor (3.33%); n = 214 MEP glia and n = 60 motor nerves in 20 animals. (C) Ternary plot showing the intensity profile of 14 MEP glia present on three adjacent motor nerves (white and yellow symbols in C correspond to white and yellow outlined arrowheads in A) for RFP, YFP and CFP, in percent. (D) Mean ± SEM of MEP glial cell divisions per motor nerve (2.19 ± 0.18) between 48 and 72 hpf; n = 27 nerves in 12 larvae. (E) DMSO control and aphidicolin/hydroxyurea (HUA)-treated nkx2.2a:nls-egfp;foxd3:mcherry larvae showing nkx2.2a+/ foxd3+ MEP glia (outlined arrowheads) along motor nerve root axons at 72 hpf. (F) Mean ± SEM of MEP glia along motor nerve roots at 72 hpf indicating 2.82 ± 0.12 MEP glia in control larvae (n = 79 hemi-segments from 10 larvae), and 0.90 ± 0.04 MEP glia in aphidicolin/HUA treated larvae (n = 89 hemi-segments from 10 larvae; p<0.0001). (G) Lateral view of a foxd3:mcherry;sox2:egfp larvae at 55 hpf showing foxd3+/sox2+ MEP glia (white outlined arrowhead) and DRG (asterisk). (H) Singe z plane transverse section of a BLBP immunostaining in foxd3:mcherry;nkx2.2a:mcerulean larvae showing BLBP+/foxd3+/nkx2.2a+ MEP glia (outlined arrowheads) outside the spinal cord along the motor nerve root at 55 hpf. Asterisks denote the DRG and yellow dashed lines denote the edge of the spinal cord. Scale bar, (A) 25 µm, (E, H) 20 µm, (G) 10 µm. |
( |
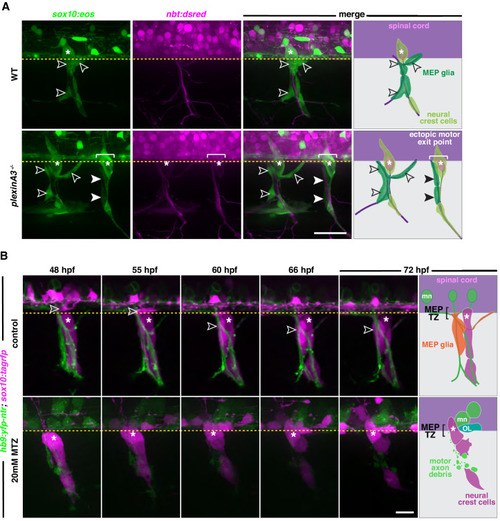
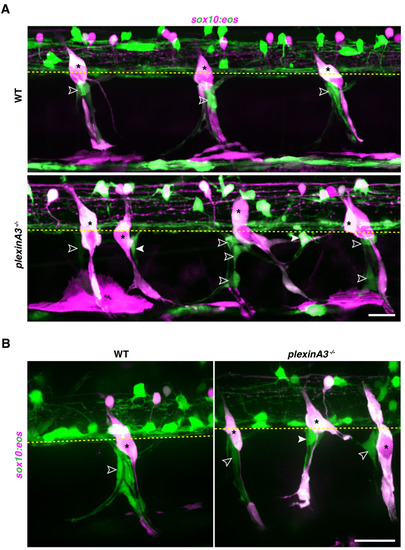
(A) Lateral view of sox10:eos;nbt:dsred WT control and plexinA3-/- siblings at 3 dpf showing MEP glia along both motor nerve axons (outlined arrowheads) and ectopic motor nerve axons (arrowheads). Brackets denote ectopic motor exit points. (B) Lateral views of sox10:tagrfp;hb9:yfp-ntr larvae from 48 to 72 hpf, treated with either 2% DMSO or 20 mM metronidazole(MTZ)/2% DMSO from 9 to 72 hpf, showing sox10+ MEP glia (white outlined arrowheads) exit the spinal cord and migrate onto healthy motor axons in the control embryo. In the MTZ-treated larvae, MEP glia did not exit the spinal cord. Asterisks denote the DRG and yellow dashed lines denote the edge of the spinal cord. Scale bar, (A) 25 µm, (B) 20 µm. |
( |
( |
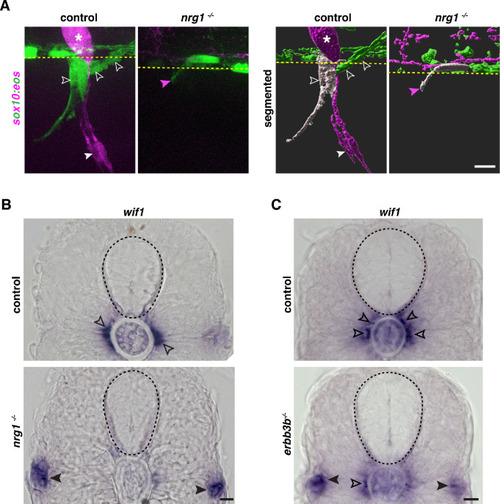
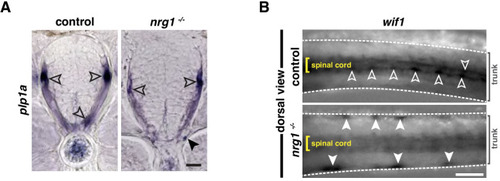
(A) Motor exit point of sox10:eos WT and nrg1 -/- siblings photoconverted at 48 hpf and imaged at 3 dpf showing the presence of MEP glia (outlined arrowheads) and Schwann cells (SCs) (arrowhead) in a control larva and the presence of an oligodendrocyte membrane extension (pink arrowhead) in a nrg1 -/- larva that lacks MEP glia and SCs. Yellow dashed lines denote the edge of the spinal cord. (B) In situ hybridization showing wif1+ MEP glia along motor nerve root axons in a WT control larva (outlined arrowheads, n = 24 larvae) and the absence of wif1+ MEP glia along motor nerve root axons in a nrg1 mutant larva at 3 dpf (n = 16 larvae). Arrowheads indicate the presence of wif1+ cells near the lateral line nerve in a nrg1 mutant larva at 3 dpf. (C) In situ hybridization showing wif1+ MEP glia along motor nerve root axons in a WT control larva (outlined arrowheads, n = 20 larvae) and the absence of wif1+ MEP glia along motor nerve root axons in an erbb3b mutant larva at 3 dpf (n = 14 larvae). Arrowheads indicate the presence of wif1+ cells near the lateral line nerve in an erbb3b mutant larva at 3 dpf. Scale bar (A–C), 10 μm. |
( |
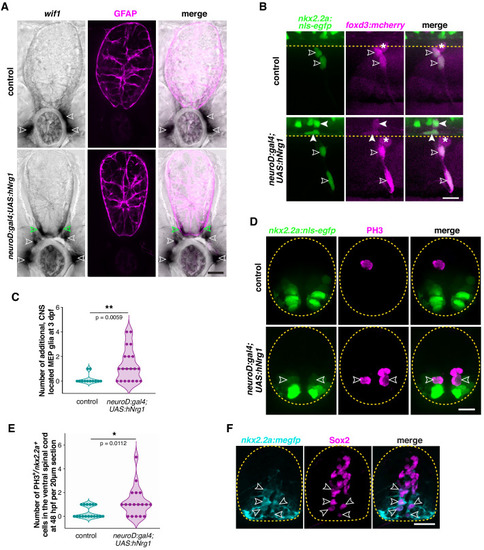
(A) In situ hybridization showing wif1+ MEP glia (white outlined arrowheads) along motor nerve roots in WT larvae (n = 30 larvae) at 3 dpf and both inside (green outlined arrowheads) and outside (white outlined arrowheads) the spinal cord in neuroD:gal4;UAS:hNrg1 larvae (n = 30 larvae). Zrf1 immunostaining shows GFAP+ radial glia and denotes the outline of the spinal cord. (B) Lateral view of 3 dpf nkx2.2a:nls-egfp;foxd3:mcherry control and neuroD:gal4;UAS:hNrg1 larvae showing nkx2.2a+/foxd3+ MEP glia (outlined arrowheads) along motor nerve root axons. MEP glia are found in both the PNS (outlined arrowheads) and in the ventral spinal cord (arrowheads) in neuroD:gal4;UAS:hNrg1 larvae. Asterisks denote the DRG. (C) Mean ± SEM of additional, centrally located MEP glia per hemi-segment in control (0.17 ± 0.11; n = 12 larvae) and neuroD:gal4;UAS:hNrg1 larvae (1.3 ± 0.3; n = 20 larvae) at 3 dpf. (D) PH3 immunostaining on spinal cord transverse sections in neuroD:gal4;nkx2.2a:nls-egfp control larvae and neuroD:gal4;UAS:hNrg1;nkx2.2a:nls-egfp larvae showing PH3+/nkx2.2a+ proliferating radial glia (outline arrowheads). (E) Mean ± SEM of PH3+/nkx2.2a+ cells in the ventral spinal cord per 20 µm section in neuroD:gal4 (0.35 ± 0.12; n = 17 sections from four embryos) and neuroD:gal4;UAS:hNrg1 larvae (1.22 ± 0.3; n = 18 sections from four embryos). (F) Transverse section of a nkx2.2a:megfp larva at 4 dpf showing Sox2+/nkx2.2a+ radial glial precursors. Yellow dashed lines denote the edge of the spinal cord. Scale bar (A,B,D,F), 10 µm. |
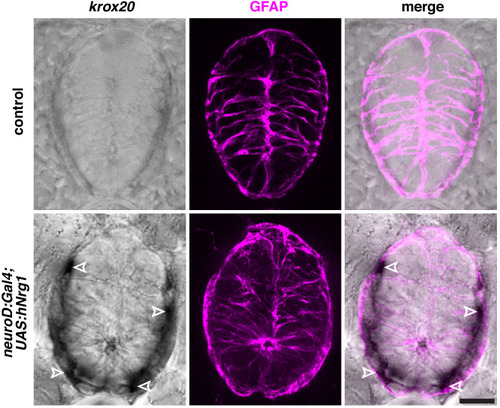
Zrf1 immunostaining shows GFAP+ radial glia and denotes the outline of the spinal cord. Scale bar, 10 µm. |
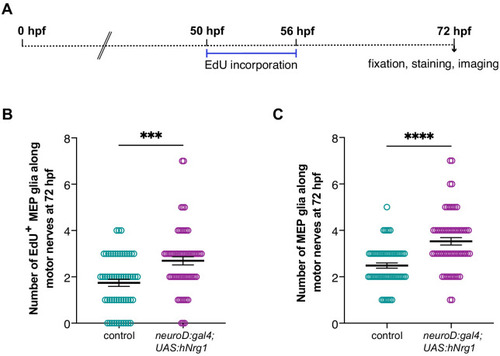
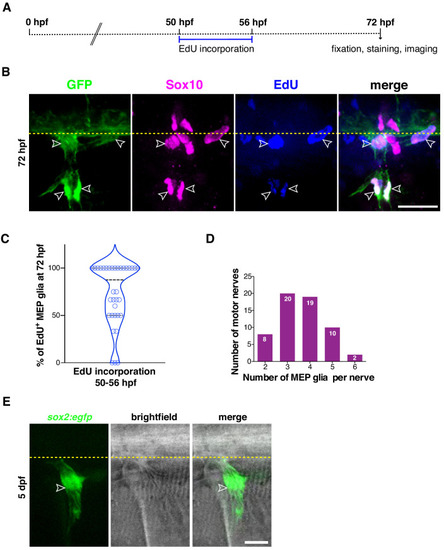
(A) Experimental design for MEP glial EdU incorporation assay. (B) Mean ± SEM of number of EdU+ MEP glia per motor nerve in control (1.74 ± 0.15) and neuroD:gal4;UAS:hNrg1 (2.70 ± 0.18) larvae at 72 hpf (p=0.0002). (C) Mean ± SEM of total number of MEP glia per motor nerve in control (2.48 ± 0.12) and neuroD:gal4;UAS:hNrg1 (3.53 ± 0.16) larvae at 72 hpf (p<0.0001). (B– C) n = 58 nerves in 10 control larvae and n = 62 nerves in 12 neuroD:gal4;UAS:hNrg1 larvae. |