
- Title
-
Small Extracellular Vesicles Deliver TGF-β1 and Promote Adriamycin Resistance in Breast Cancer Cells
- Authors
- Tan, C., Sun, W., Xu, Z., Zhu, S., Hu, W., Wang, X., Zhang, Y., Zhang, G., Wang, Z., Xu, Y., Tang, J.
- Source
- Full text @ Mol. Oncol.

sEV‐mediated intercellular transmission of adriamycin resistance. (A) sEVs were isolated from the culture medium of MCF/Adr cells and characterized by TEM. (B) The isolated sEVs were further examined by the determination of exosome‐specific proteins CD63, TSG101, and Alix by western blots. Calnexin serves as a cytosolic protein control. (C) MCF‐7 cells were labeled with GFP, and A/sEVs were labeled with PKH26 (red). After incubation of cells with sEVs, sEV intracellular localization was observed using a confocal microscope. Images in the low panel were representative for images in boxes as indicated in the top panel. (D) MCF‐7 cells were incubated with S/sEVs or A/sEVs and then treated with different concentrations of adriamycin as indicated. The cell viability after normalized with cell plating efficiency was analyzed by MTT assay. No sEVs added were a negative control. (E) After cell‐sEV incubation and drug treatment, adriamycin resistance was analyzed by cell colony survival assay. All experiments were repeated, and more than three replicates were included in D and E. The data were presented as the mean ± standard deviation. * |

Cytokine abundances in A/sEVs vs. S/sEVs. (A) sEVs isolated from MCF‐7 and MCF‐7/Adr cells were subjected to a human cytokine antibody array to quantify the levels of targeted cytokines. A red box indicated TGF‐β1 profiling. (B) Increased abundances of BCa metastasis‐associated cytokines in A/sEVs vs. S/sEVs. (C) The amounts of TGF‐β1 in A/sEVs and S/sEVs were quantified using a specific ELISA Kit. (D) Alters in cell signaling pathways and relating inflammatory disease and cancers were analyzed using a KEGG enrichment analysis software. Each group of sEVs containing four replicates were quantified, and the significant differences between S/sEVs and A/sEVs were indicated in B and C. |
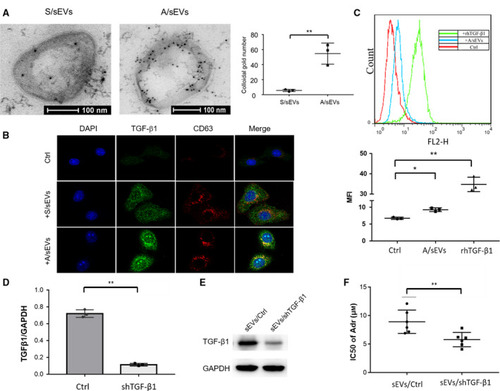
The effect of sEVs/ TGF-β1 on intercellular adriamycin-resistant transmission. (A) TGF-β1 sorting to sEVs was determined by an immune electron microscope. sEV-embedded gelatin ultracryotomy was incubated with TGF-β1 antibody for staining sEV-carried TGF-β1, and the images were observed by TEM. The amounts of TGF-β1 sorting to sEVs were quantified. (B) After cell-sEV incubation, intracellular co-localization of TGF-β1 with uptake of sEVs was verified by confocal microscope using TGF-β1 antibody (green) and CD63 antibody (red). (C) TGF-β1 abundance was quantified using flow cytometry with the TGF-β1 antibody. (D) TGF-β1 in MCF-7/Adr cells was knocked down using a specific shRNA and confirmed by RT–qPCR. A scramble sequence serves as a control. (E) sEVs were isolated from the TGF-β1-silenced MCF-7/Adr cells, and the reduced level of TGF-β1 was confirmed by western blots. (F) MCF-7 cells were incubated with the isolated sEVs and then treated with adriamycin. The cytotoxicity was quantified by MTT assay and calculated IC50 value. All experiments were repeated, and more than three replicates were included in A and C–F. The data were presented as the mean ± standard deviation. *P < 0.05 and **P < 0.01 represent the significances between two groups as indicated. |
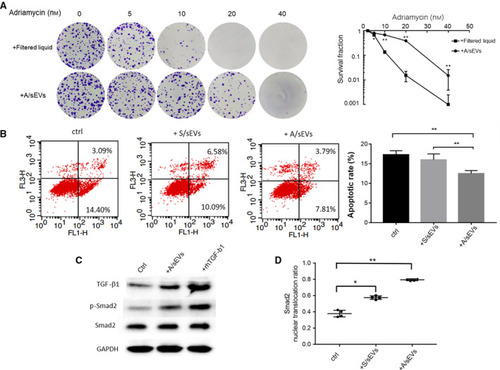
The effects of sEVs on inhibition of apoptosis in the recipient cells. (A) The isolated A/sEVs were finally purified using a specific column to remove soluble molecules accompanied by sEVs, and the eluted sEVs and filtered liquids were incubated with MCF‐7 cells. After treated with adriamycin as indicated, the cell survival rate was determined by clonogenic assay. (B) MCF‐7 cells were incubated with S/sEVs and A/sEVs and then treated with adriamycin, and the apoptotic cells were quantified by flow cytometry. The reduction in apoptosis by uptake of sEVs was calculated. ** |
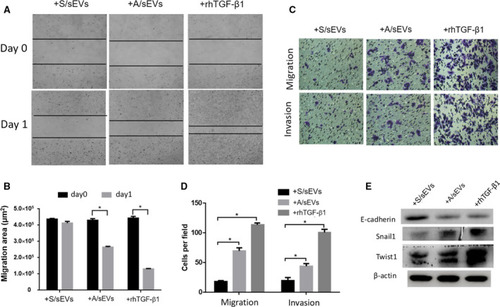
The effects of sEVs on EMT activation in the recipient cells. (A) After cell‐sEV incubation, the ability of wound closure of the recipient cells was measured using cell wound‐healing assay. (B) 24 h after incubation, unclosed areas were calculated. (C) After cell‐sEV incubation, cell invasion and migration capacities were analyzed by transwell assay. (D) The numbers of invaded and migrated cells were plotted. (E) The EMT markers expressed in the recipient cells were measured by western blots. Treatment of rhTGF‐β1 was used as a positive control. All experiments were repeated, and more than three replicates were included in A–D. The data were presented as the mean ± standard deviation. * |

Exosome‐mediated drug resistance transmission in MCF‐7 cell‐formed tumors in zebrafish. (A) PKH26‐labeled MCF‐7 cells were incubated with S/sEVs, A/sEVs, and TGF‐β1 silenced A/sEVs. The exosome‐internalized cells were injected into zebrafish embryos. The hatched fishes were grown with 50 µ |