FIGURE SUMMARY
Title

Tumor Necrosis Factor and Schistosoma mansoni egg antigen omega-1 shape distinct aspects of the early egg-induced granulomatous response

Authors
Takaki, K.K., Roca, F.J., Schramm, G., Wilbers, R.H.P., Ittiprasert, W., Brindley, P.J., Rinaldi, G., Berriman, M., Ramakrishnan, L., Pagán, A.J.
Source
Full text @ PLoS Negl. Trop. Dis.

TNF affects late-stage granuloma formation.

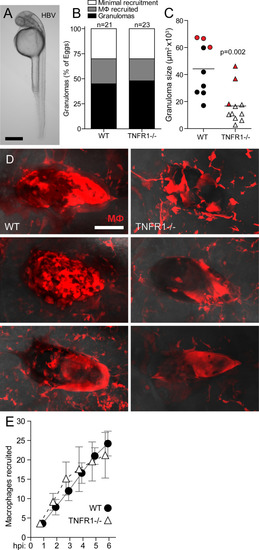
Comparison of macrophage recruitment and granuloma formation in WT and TNFR1 mutant zebrafish larvae with fluorescent macrophages following implantation with a single schistosome egg into their hindbrain ventricle. (A) Zebrafish larva at 36 hours post-fertilization with the hindbrain ventricle (HBV) site of injection and implantation outlined. Scale bar, 300 μm. (B-D) Granuloma formation at 5 days post-implantation. (B) Percent of animals with; granuloma formation (confluent epithelioid macrophage aggregates), macrophages recruited (>6 macrophages in contact with the egg), or minimal recruitment (0–6 macrophages in contact with egg) [4]. (C) Granuloma size and (D) images, with each image from top to bottom corresponding with each red data point, top to bottom, respectively. Scale bar, 50 μm. Horizontal bars in (C), means. Statistics, Student’s t-test. (E) Mean macrophage recruitment kinetics during the first 6 hours post-implantation. Error bars, SEM. Sample size, n = 5 animals per group.

Omega-1 recruits macrophages via its RNase activity.

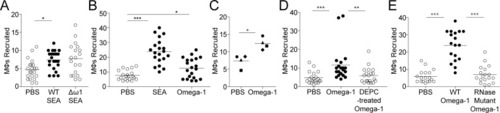
Macrophage recruitment at 6 hours post-injection (hpi) with egg antigens. (A) Macrophages recruited to SEA from WT or omega-1 knockout eggs (Δω1). (B) Macrophages recruited to SEA or omega-1. (C) Mean macrophage recruitment to omega-1 for each of four experiments. Individual experiments represented with unique symbols; triangles and squares represent means of panels B and D, respectively. (D) Macrophages recruited to omega-1 or DEPC-treated omega-1. (E) Macrophages recruited to WT or RNase mutant omega-1. All omega-1 injections were performed using 0.02 ng of plant-expressed omega-1, with the exception of (E) which used HEK-expressed WT or mutant omega-1 injected at a 5-fold higher concentration of 0.1 ng to compensate for lack of LeX glycosylation in plant-expressed and natural omega-1. Statistics, ANOVA with Dunnett’s post-test comparing all samples to PBS (B) or WT (A,E); (D) non-parametric ANOVA with Dunn’s post-test comparing all samples to omega-1; (C) paired t-test. All horizontal bars, means. Statistics; * p<0.05, ** p<0.01, and *** p<0.001.

Acknowledgments
This image is the copyrighted work of the attributed author or publisher, and ZFIN has permission only to display this image to its users. Additional permissions should be obtained from the applicable author or publisher of the image. Full text @ PLoS Negl. Trop. Dis.