FIGURE SUMMARY
Title

Cardiac Regeneration and Tumor Growth-What Do They Have in Common?

Authors
Dicks, S., Jürgensen, L., Leuschner, F., Hassel, D., Andrieux, G., Boerries, M.
Source
Full text @ Front Genet

(A) Principal component analysis plot of log2-expression (counts per million) of mRNA samples of the zebrafish data. Each color represents a different condition. (B) Soft-clustering of log2FC of the zebrafish data over time. Black lines visualize the average dynamics of the clusters. (C) Gene Set Enrichment Analysis (Fisher's Test) of genes from every cluster of gene ontology biological processes. Gene sets are connected by an edge if they share 40% of genes. Terms are connected to the clusters based on their p-value. Size of the nodes is anticorrelated to the p-value. (D) Bar plot of Gene set enrichment analysis (Fisher's Test) of genes from every cluster for Hallmarks of Cancer. The gene-ratio represents the number of regulated genes in the relation to the gene set size. Gene-ratio of genes regulated within each term divided by the total number of genes within the respective term. Color coded bar depicts the –log10 adj. PV (FDR).

(A) A representative Principal Component Analysis of log2-expression (counts per million) of mRNA samples from The Cancer Genome Atlas Kidney Chromophobe (TCGA-KICH) cancer data set. Colors represent the conditions: tumor and normal. (B) Heatmap of Gene Set Enrichment Analysis of Gene Ontology biological processes for the tumor entities. Tumor entities and gene sets were hierarchically clustered based on Euclidean distance. The color bar represents whether the given term is significantly regulated. The black and white coded bar represents whether the given term is significantly regulated or not; the color coded bars depict the different tumor entities with the given abbreviation (see Supplementary Table 1) and the up- and down-regulated terms. (C) Heatmap of Gene Set Enrichment Analysis of Hallmarks of Cancer for the tumor entities. Tumor entities and gene sets were hierarchically clustered based on Euclidean distance. The black and white coded bar represents whether the given term is significantly regulated or not; the color coded bars depict the different tumor entities with the given abbreviation (see Supplementary Table 1) and the up- and down-regulated terms.

(A) Heatmap of the significantly regulated Gene Ontology biological processes terms in the dynamic clusters compared to tumor entities. Dynamic clusters and tumor entities were hierarchically clustered based on their significantly regulated gene sets. The black and white coded bar represents whether the given term is significantly regulated or not; the color coded bars depict the different tumor entities with the given abbreviation (see Supplementary Table 1), the up- and down-regulated terms and the dynamic zebrafish clusters. (B) Heatmap of the significantly regulated gene sets Hallmarks of Cancer in the dynamic clusters compared with the tumor entities. Dynamic clusters and tumor entities were hierarchically clustered based on their significantly regulated gene sets. The black and white coded bar represents whether the given term is significantly regulated or not; the color coded bars depict the different tumor entities with the given abbreviation (see Supplementary Table 1), the up-and downregulated terms and the dynamic zebrafish clusters. (C) Heatmap of differential expression (log2FC) of all genes in gene ontology biological processes term: cell cycle DNA Replication. Zebrafish samples and tumor entities were hierarchically clustered based on their differential gene expression. The color coded bar depicts the log2FC. (D) Heatmap of differential expression (log2FC) of all genes in hallmark: myc targets v2. Zebrafish samples and tumor entities were hierarchically clustered based on their differential gene expression. The color coded bars represent the log2FC, the different tumor entities with the given abbreviation (see Supplementary Table 1) and the two zebrafish days post injury (dpi).

(A) Heatmap of the Gene Ontology biological processes terms that are significantly regulated in the zebrafish dynamic clusters and the neonatal mice samples. Dynamic clusters and neonatal mice samples were hierarchically clustered based on their significantly regulated gene sets. The black and white coded bar represents whether the given term is significantly regulated or not. The color coded bars depict the different mice samples, the up- and down-regulated terms and the dynamic zebrafish clusters. (B) Differential expression (log2FC) of the gene Igf2bp3 in the zebrafish time series. The red line describes the trend of the log2FC and the black line is a straight connection between time points. The dotted line represents the cut off for significant differential expression.

(A) Dot plot of Gene Set Enrichment analysis of mRNAs from every cluster regulated by miRNA for Gene Ontology biological processes. For each cluster, only the top 10 terms were shown. The color coded bar depicts the –log10 PV of each term. (B) Dot plot of Gene Set Enrichment Analysis of mRNAs regulated by miRNA for every cluster for Hallmarks of Cancer. The color coded bar represents the –log10 PV of each term.

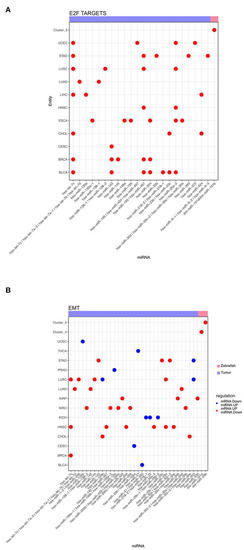
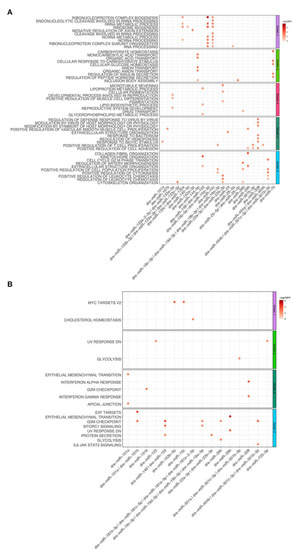
Dot plot of miRNA that significantly regulates the hallmarks (A) E2F targets and (B) epithelial mesenchymal transition for zebrafish dynamic clusters and tumor entities.

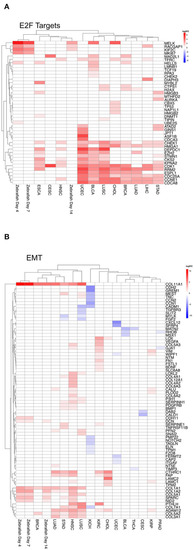
Heatmap of differential gene expression of significantly regulated mRNAs modulated by miRNA in the hallmarks (A) E2F targets and (B) epithelial mesenchymal transition for zebrafish samples and tumor entities. Dynamic clusters and tumor entities were hierarchically clustered based on their differentially expressed mRNAs. The color coded bar represents the log2FC.

Acknowledgments
This image is the copyrighted work of the attributed author or publisher, and ZFIN has permission only to display this image to its users. Additional permissions should be obtained from the applicable author or publisher of the image. Full text @ Front Genet