FIGURE SUMMARY
Title

In vivo biomolecular imaging of zebrafish embryos using confocal Raman spectroscopy

Authors
Høgset, H., Horgan, C.C., Armstrong, J.P.K., Bergholt, M.S., Torraca, V., Chen, Q., Keane, T.J., Bugeon, L., Dallman, M.J., Mostowy, S., Stevens, M.M.
Source
Full text @ Nat. Commun.

Schematic overview of the confocal Raman spectroscopic imaging applications in zebrafish embryos developed in this study.

a Confocal Raman spectroscopic imaging (cRSI) is a label-free imaging technique that uses molecular vibrations from Raman scattering to generate biomolecular images of the zebrafish embryo. b Characterization and tissue analysis of zebrafish embryos. cRSI can provide three-dimensional biomolecular information from an entire zebrafish embryo or high-resolution imaging of specific tissue regions. c Biomolecular profiling of bacterial infection. cRSI can be used to probe local biomolecular variation in bacterial populations after infection. We demonstrated this approach by using volumetric cRSI to discriminate between wild type and region of difference 1 (ΔRD1) mutant Mycobacterium marinum in a zebrafish infection model. d In vivo time-lapse analysis of wound response. In vivo cRSI can be used to collect Raman spectroscopic images at multiple time points in living embryos and used for time-lapse biomolecular analysis. We demonstrated this concept by following a wound response model for 12 h in living zebrafish embryos.

Volumetric confocal Raman spectroscopic imaging of whole zebrafish embryos.

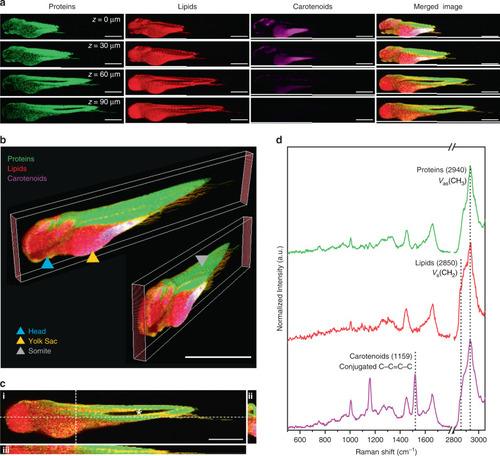
Confocal Raman spectroscopic imaging (cRSI) was used to image a fixed embryo (N = 1) at 3 days post fertilization at 10 μm in-plane resolution and 10 μm out-of-plane resolution. a Single images collected at different confocal planes with normalized univariate peak intensity (a full dataset with all confocal planes is shown in Supplementary Fig. 1). The Z-position relative to the top slice of the stack is indicated. Scale bars: 500 μm. b These individual confocal planes were reconstructed into a multichannel 3D stack with 10 x 10 x 10 µm3 voxel resolution, enabling whole-embryo visualization at different angles. The blue triangle indicates the head, the orange triangle indicates the yolk sac, and the grey triangle indicates a somite. Scale bar: 1 mm. c Z-projections were also generated enabling cross-sectional visualization of (i) the sagittal plane, (ii) the frontal plane and (iii) the transverse plane. The asterisk in the sagittal plane denotes the hollow notochord, which can also be visualized as a cross-section in the transverse plane images. Scale bar: 500 µm. d Representative spectra collected from volumetric cRSI performed on whole zebrafish embryos. The annotated peak centers used for univariate analysis are indicated by dotted lines. Univariate analysis was performed by integrating over a wavenumber range corresponding to relevant biomolecules: protein-rich regions at 2940 ± 16 cm−1 (shown in green), lipid-rich regions at 2850 ± 5 cm−1 (shown in red), carotenoid-rich regions at 1159 ± 16 cm−1 (shown in magenta).

High-resolution confocal Raman spectroscopic imaging for anatomical tissue characterization.

Confocal Raman spectroscopic imaging (cRSI) was used to image tissue regions of interest at 3 days post fertilization, with a spatial resolution of 0.5–1 µm. Univariate analysis was performed by integrating over a wavenumber range corresponding to relevant biomolecules: collagen-rich regions at 918 ± 20 cm−1 (shown in yellow), DNA-rich regions at 789 ± 10 cm−1 (shown in blue), lipid-rich regions at 2850 ± 10 cm−1 (shown in red), cytochrome-rich regions at 1579 ± 15 cm−1 (shown in cyan). a A representative image of the dorsal muscle tissue, from three independent cRSI scans (N = 3). Scale bar: 40 µm. b An exemplar scan of the tail tissue of a single embryo (N = 1), with the white asterisk indicating the notochord. Scale bar: 50 µm. c An exemplar scan of the developing gut of a single embryo (N = 1), with the orange asterisk marking the gut lumen and the grey triangle points indicating the gut lining. Scale bar: 40 µm. d Exemplar Raman spectra obtained from regions of intense univariate signal, with the labeled peaks used for univariate analysis.

Confocal Raman spectroscopic imaging analysis of zebrafish embryo model of tuberculosis.

An established model was used in which zebrafish embryos were injected with M. marinum to form localized mycobacterial lesions. All analysis was performed at 4 days post injection. a The model was verified by staining the lesions with a Ziehl–Neelsen stain, highlighting acid-fast mycobacteria (regions of purple), with a representative image selected from three independent biological replicates (N = 3). Scale bar: 20 µm. b Transmission electron micrograph of a mycobacterial lesion, a representative image of two independent biological replicates (N = 2). Osmium staining revealed the presence of mycobacteria (red arrows) with dense lipid clusters (stained black). The plasma membrane of the host cell is also visible (orange arrow). Scale bar: 2 µm. c Confocal Raman spectroscopic imaging (cRSI) was used to image mycobacterial lesions. The image shown is representative of four independent biological replicates (N = 4). Univariate analysis was performed by integrating over a wavenumber range corresponding to relevant biomolecules: protein-rich regions at 2940 ± 16 cm−1 (shown in green), lipid-rich regions at 2854 ± 10 cm−1 (shown in red), DNA-rich regions at 789 ± 10 cm−1 (shown in blue). Scale bars: 40 µm. d Representative spectra obtained from cRSI.

Biomolecular profiling and discrimination of mycobacterial infections.

a Volumetric confocal Raman spectroscopic imaging (cRSI) of zebrafish embryos infected with either wild type or ∆RD1 M. marinum or injected with PBS as a negative control. cRSI was performed at 4 days post injection, and 3D reconstructions show embryo tissue in gray with mycobacterial clusters displayed in red (wild type) or blue (∆RD1). Scale bars: 50 µm. b Mean spectra of the mycobacterial clusters extracted from the volumetric cRSI scans for wild type M. marinum (red trace) and the ∆RD1 mutant bacteria (blue trace). c Principal component analysis showed clear separation of the wild type M. marinum (red markers) and the ∆RD1 mutant bacteria (blue markers) using the three principal components (PC1, PC2, PC3).

cRSI of living zebrafish embryo wound response.

Living zebrafish were imaged for the 12 h following a controlled stab wound performed at 3 days post fertilization. a Confocal fluorescence microscopy of F-actin was highlighted by phalloidin staining (red) at 3, 6 and 12 hours post wounding (hpw) on three independent biological replicates at each time point (N = 3). b Univariate analysis of the confocal Raman spectroscopic imaging (cRSI) scans of a living zebrafish embryo at 1–3, 4–6 and 10–12 hpw. Univariate analysis was performed by integrating over a wavenumber range at 1450 ± 30 cm−1. c The tissue damage in these images was clearly visualized by using multivariate vertex component analysis (VCA), with the wounded component displayed in red and the unwounded component displayed in green. A water component (black) and a pigment component (yellow) were also identified. Scale bars: 40 µm. d The three tissue endmembers identified by VCA (the water endmember spectra not shown). e Analysis of the unwounded and wounded endmembers identified by the VCA. The difference spectrum when the wounded endmember was subtracted from the unwounded endmember. The horizontal dashed line indicates zero difference between the two endmembers. The dotted vertical lines indicate the center of the annotated peaks that were clearly different between wounded and unwounded tissue, with the color coding indicating in which component they were dominant. Green indicates higher presence in the unwounded component and red indicates higher presence in the wounded component. f Relative abundance of wounded and unwounded component in the injured somite at the three time points extracted from pixel intensity histograms produced by the VCA. The wounded component is shown in red and the unwounded component is shown in green. Figures 6b–f are a representative set of images and analysis taken from three independent biological replicates (N = 3).

Acknowledgments
This image is the copyrighted work of the attributed author or publisher, and ZFIN has permission only to display this image to its users. Additional permissions should be obtained from the applicable author or publisher of the image. Full text @ Nat. Commun.