FIGURE SUMMARY
Title

Long noncoding RNAs implicated in embryonic development in Ybx1 knockout zebrafish

Authors
Huang, C., Zhu, B., Leng, D., Ge, W., Zhang, X.D.
Source
Full text @ FEBS Open Bio

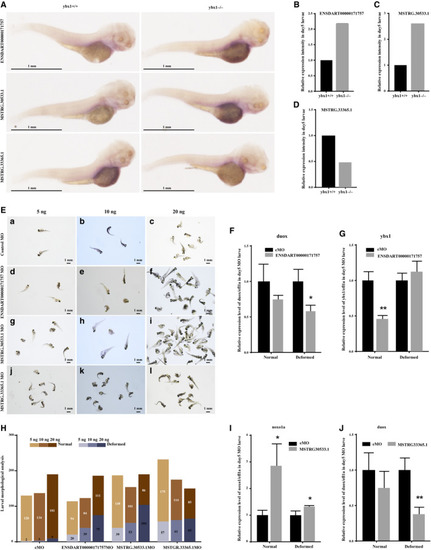
lncRNA knockdown led to larvae morphological deformation. (A) Whole‐mount in situ hybridization analysis of the three selected lncRNAs (ENSDART00000171757, MSTRG.30533.1 and MSTRG.33365.1) in day 5 ybx1+/+ and ybx1−/− larvae. Top: the expression of ENSDART00000171757 lncRNA in day 5 ybx1+/+ and ybx1−/− larvae. Middle: the expression of MSTRG.30533.1 lncRNA in day 5 ybx1+/+ and ybx1−/− larvae. Bottom: the expression of lncRNA MSTRG.33365.1 in day 5 ybx1+/+ and ybx1−/− larvae. Scale bars: 1 mm. (B–D) Relative expression intensity of ENSDART00000171757, MSTRG30533.1 and MSTRG33365.1 in day 5 ybx1+/+ and ybx1−/− larvae. (E) Larval morphological analysis after lncRNA morpholino injection on day 5. (a–l) Photographs of deformed larvae injected with different doses (5, 10 and 20 ng) of morpholino for lncRNA (ENSDART00000171757, MSTRG.30533.1 and MSTRG.33365.1), and control morpholino injected larvae were used as reference. Scale bars: 1 mm. (F,G) Relative expression of duox mRNA and ybx1 mRNA in day 5 larvae after injection of 20 ng ENSDART00000171757 morpholino. (H) Larval morphological statistics for different lncRNA morpholino larvae injected with different doses (5, 10 and 20 ng); control morpholino injection was used for reference. Column in brown represents larvae with normal morphology, and purplish blue column stands for deformed morphological larvae. (I) Relative expression of noxo1a mRNA in day 5 larvae after injection of 20 ng MSTRG.30533.1 morpholino. (J) Relative expression of duox mRNA in day 5 larvae after 20 ng MSTRG.33365.1 morpholino injection. 20 ng control morpholino injected larvae was used as reference. On day 5, morpholino‐injected larvae were divided into two groups, normal and deformed morphology. Columns in black represent control morpholino (cMO), and gray columns stand for targeted lncRNA morpholino. *P < 0.05, **P < 0.01. Error bars indicate standard deviation. Wilcox test was used to determine significance or lack thereof. The experiments were replicated three times.

Acknowledgments
This image is the copyrighted work of the attributed author or publisher, and ZFIN has permission only to display this image to its users. Additional permissions should be obtained from the applicable author or publisher of the image. Full text @ FEBS Open Bio