FIGURE SUMMARY
Title

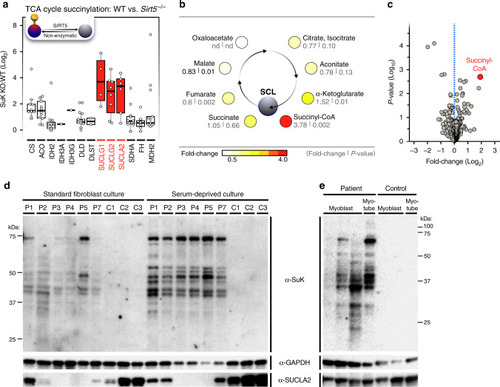
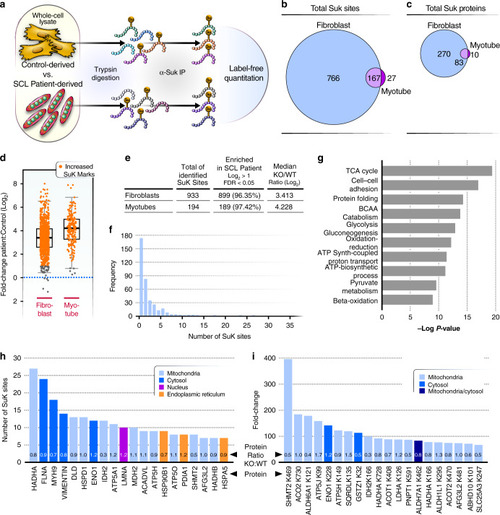
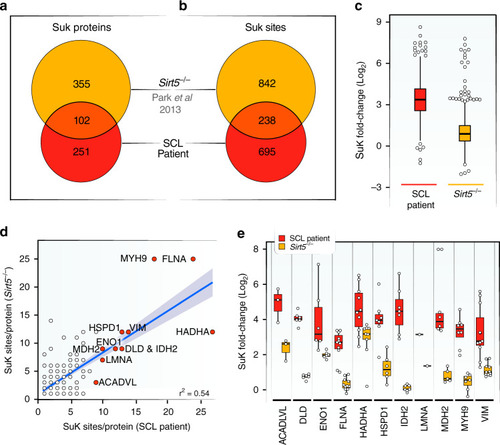
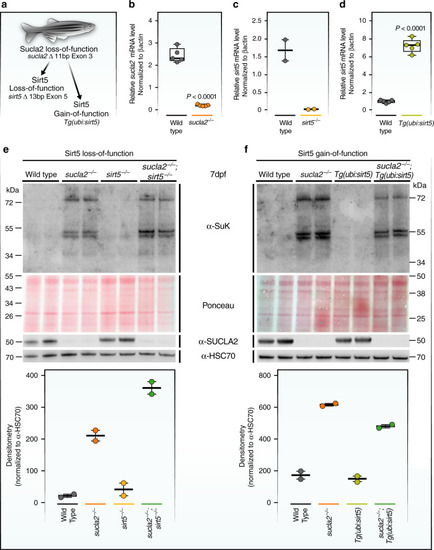
SUCLA2 mutations cause global protein succinylation contributing to the pathomechanism of a hereditary mitochondrial disease

Authors
Gut, P., Matilainen, S., Meyer, J.G., Pällijeff, P., Richard, J., Carroll, C.J., Euro, L., Jackson, C.B., Isohanni, P., Minassian, B.A., Alkhater, R.A., Østergaard, E., Civiletto, G., Parisi, A., Thevenet, J., Rardin, M.J., He, W., Nishida, Y., Newman, J.C., Liu, X., Christen, S., Moco, S., Locasale, J.W., Schilling, B., Suomalainen, A., Verdin, E.
Source
Full text @ Nat. Commun.

SCL deficiency causes global protein hyper-succinylation.

a Quantitation of murine liver proteome succinylation shows TCA cycle enzymes are targets of lysine succinylation in mice (C57/BL6, n = 10 wild-type, n = 10 Sirt5−/−). The SCL complex shows higher fold-changes than other TCA cycle enzymes. “Su” in the scheme indicates a succinylation modification that is removed by SIRT5. The boxplot shows the median, the first to third quartile, the 1.5x interquartile ranges, and outliers. b Untargeted metabolomics show more succinyl-CoA and α-ketoglutarate in patient-derived fibroblasts than in control fibroblasts. The color scale indicates fold-change. c Volcano plot of metabolite changes in fibroblasts from SCL patients and control fibroblasts. The red dot shows succinyl-CoA. d SDS-PAGE and western blot analysis of lysine succinylation in fibroblasts cultured in standard culture conditions (proliferative condition) and cells cultured for 5 days in low-serum conditions (non-proliferative condition). Patients (P1–P7) carry disease-causing mutations in SUCLA2. Controls (C1–C3) are fibroblasts from age-matched patients with other mitochondrial diseases. e SDS-PAGE and western blot analysis of lysine succinylation during myoblast differentiation in myotubes (arrow indicates stages of differentiation) of patient with SCL deficiency due to Asp333Gly mutation in SUCLA2. Control is an age-matched patient with a non-mitochondrial disease. GAPDH was used as a loading control, and residual SUCLA2 levels in patient samples are shown. Western blot images are representative results from 10 different independent experiments with similar results. The p-values were calculated with Welch two-sample t-test assuming unequal variance. Source data are provided as a Source Data file. WT = wild-type; SuK = succinyl-lysine, nd = not determined.

Proteomics analysis of protein lysine succinylation.

a Workflow for label-free proteomics quantitation of succinyl-lysine residues in whole-cell lysates of fibroblasts and myotubes from SCL patients and controls. Samples were trypsin-digested. Succinylated lysines were enriched by immune affinity and analyzed by mass spectrometry (n = 2 control, n = 3 SCL patient-derived fibroblasts; n = 2 control, n = 1 patient-derived myotubes; A technical replicate of patient-derived myotube samples was used). b Venn diagram of total number of succinylated lysine sites identified in fibroblasts and myotubes. c Venn diagram of total number of proteins carrying succinyl-lysine sites. d Boxplot of fold-changes of succinyl-lysine mean intensities in fibroblasts and myotubes from patients compared to controls. Orange points indicate lysine marks enriched significantly more in patient samples, compared to controls. The boxplot shows the median, the first to third quartile, the 1.5x interquartile ranges, and outliers. e Table of identified SuK sites in fibroblasts and myotubes showing total numbers of SuK sites, numbers of SuK sites significantly enriched in SCL patient samples, and the median values of log2-transformed ratios of patient-derived samples, compared to that from control cells. f Distribution of frequencies of succinylated lysine PTMs per detected protein. More than half of the proteins contain only one succinylated lysine. Oher proteins carry more than one SuK mark with a maximum of 27 SuK PTMs. g GO biological process term enrichment analysis of hyper-succinylated proteins from the fibroblast samples. Statistical significance was determined using fisher exact test. h Barplot of the 20 proteins with the highest numbers of SuK marks identified in our analysis. Highly succinylated proteins are found in different cellular compartments, including mitochondria, the nucleus, the endoplasmic reticulum and the cytosol. Protein ratio indicates levels of proteins in SCL patient-derived cells vs control cells. i Barplot of the 20 most dynamically affected succinylation marks in the absence of SUCLA2 as detected in this analysis. Source data are provided as a Source Data file. SuK= succinyl-lysine; TCA = tricarboxylic acid; BCAA = branched chain amino acid.

Common succinylated targets in SCL and SIRT5 deficiencies.

a Venn diagram of succinylated proteins identified in SCL patient fibroblasts and in mouse embryonic fibroblasts from Sirt5−/− mice. Results from this study were compared to data deposited by Park et al.26. b Venn diagram showing number of sites that are susceptible to hyper-succinylation in both conditions. Pairwise sequence alignments identified each lysine showing significant changes in succinylation levels in both data sets. c Boxplot of fold-changes of lysine succinylation found in SCL-deficient patient cells and mouse embryonic fibroblasts from Sirt5−/− mice (n = 2 control fibroblast samples, n = 3 SCL patient-derived fibroblast samples; n = 2 control fibroblast samples, n = 1 patient-derived myotube samples; A technical replicate of patient-derived myotube samples was used). d Correlation of the number of suK marks on individual proteins found in data sets from SCL patient and Sirt5−/− fibroblasts. Orange dots indicate the 11 most succinylated proteins in number of modified lysine sites identified in fibroblasts from SCL deficient patients (Total of 189 proteins, r2 = 0.54). Gray band indicates 95% confidence interval. Red dots indicate the 11 proteins with the highest number of succinylation sites in SCL patient fibroblasts. e Boxplot showing fold-changes in succinylation of individual lysine residues among the 11 proteins with the highest numbers of suK marks. Note that only sites matched by sequence alignment of our human data to published mouse data are included in this analysis. The boxplots show the median, the first to third quartile, the 1.5x interquartile ranges, and outliers. SuK = succinyl-lysine.

Sirt5 modulates global protein succinylation in a zebrafish model of SCL deficiency.

a Schematic representation of genetic backgrounds used for zebrafish experiments. b Relative sucla2 mRNA levels in sucla2−/− zebrafish (n = 5 pools of 6 larvae, 7 dpf). c Relative sirt5 mRNA levels in sirt5−/−zebrafish (n = 2 tissue samples from adult skeletal muscle, adults of 3 months). d Relative sirt5 mRNA expression in Tg(ubi:sirt5;cryaa:zsgreen) transgenic zebrafish (n = 5 pools of 8 larvae, 8 dpf). All data in bd, compared to wild-type siblings and normalized to βactin mRNA levels. p-values are calculated by standard unpaired t-tests for b and d. e SDS-page and western blot analysis of global protein succinylation in zebrafish larvae with homozygous mutations in sucla2, sirt5, or combined gene deficiencies and controls (7 dpf, n = 2 pools of 10–15 larvae) and f Pan-succinyl-lysine western blots of samples from larvae overexpressing sirt5 in wild-type or sucla2−/− animals (n = 2 pools of 10 to15 larvae, 7dpf). Pan-succinyl-lysine antibodies were used to quantify lysine succinylation, and Hsc70 antibodies were used as loading controls. Ponceau staining serves as an additional loading control. Boxplots in e, f show quantifications of western blots using the mean of the densitometry of the three main bands, normalized to Hsc70. The boxplots show the median, the first to third quartile, and minima and maxima. Western blot images are derived from a single experiments. Source data are provided as a Source Data file. Bp = base pairs.

Sirt5 restores oxidative metabolism and improves survival of <italic>sucla2</italic><sup>−/−</sup> zebrafish.

a Oxygen consumption rate (OCR) in sucla2−/− and control zebrafish larvae with or without sirt5 overexpression (n = 15 per group, 10dpf), before and after the addition of inhibitors of mitochondrial respiration. The uncoupler FCCP is added to stimulate maximal OCR. Rotenone and antimycin A (R + A) determine non-mitochondrial respiration. b Basal OCR calculating the average of the three last points before addition of FCCP. c maximal OCR. d qPCR analysis of mitochondrial DNA content in sucla2−/− and control zebrafish larvae with or without sirt5 overexpression (n = 12 per group, 10dpf). e Survival of sucla2−/− and control zebrafish larvae with or without sirt5 overexpression in standard (fed) conditions (sucla2+/+, n = 40; sucla2−/−, n = 37; sucla2+/+;Tg(ubi:sirt5), n = 38; sucla2−/−;Tg(ubi:sirt5), n = 36). Data are pooled from two independent experiments. p-Value for median survival of wild type vs sucla2−/− <0.0001, p-value sucla2−/− vs sucla2−/−;Tg(ubi:sirt5) = 0.00061. Pairwise comparison using log-rank test. p-Value adjustment was performed by Bonferroni correction. The boxplots show the median, the first to third quartile, and minima and maxima). n.s., not significant. mtDNA = mitochondrial DNA; dpf = days post fertilization. Source data are provided as a Source Data file.

Acknowledgments
This image is the copyrighted work of the attributed author or publisher, and ZFIN has permission only to display this image to its users. Additional permissions should be obtained from the applicable author or publisher of the image. Full text @ Nat. Commun.