
- Title
-
Duplicated dnmt3aa and dnmt3ab DNA Methyltransferase Genes Play Essential and Non-Overlapped Functions on Modulating Behavioral Control in Zebrafish
- Authors
- Lai, Y.H., Audira, G., Liang, S.T., Siregar, P., Suryanto, M.E., Lin, H.C., Villalobos, O., Villaflores, O.B., Hao, E., Lim, K.H., Hsiao, C.D.
- Source
- Full text @ Genes (Basel)
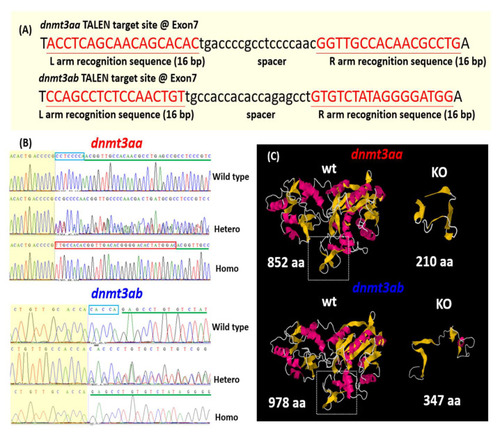
Generation of |
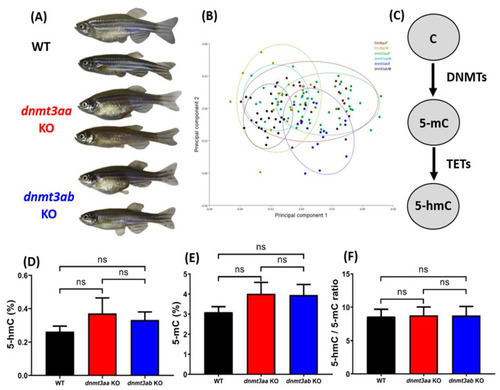
Morphometric and DNA methylation level comparison for wild types, PHENOTYPE:
|
Comparison of behavior endpoints among the wild-type, PHENOTYPE:
|

Comparison of mirror biting behavior endpoints among wild-type, PHENOTYPE:
|

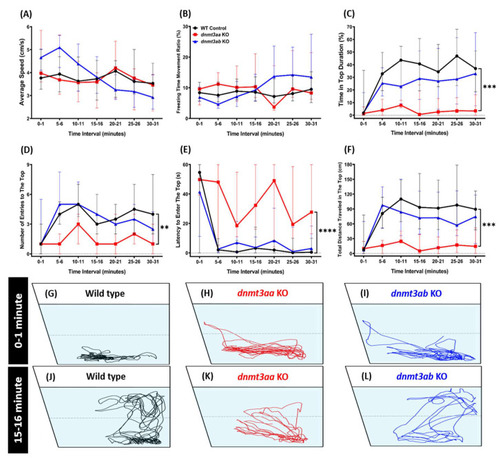
Comparison of predator avoidance behavioral endpoints among the wild-type, PHENOTYPE:
|

Comparison of conspecific behavior endpoints among the wild-type, PHENOTYPE:
|
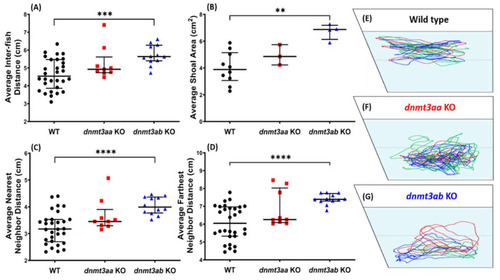
Comparison of shoaling behavior endpoints among the wild-type, the PHENOTYPE:
|

The circadian rhythm locomotor activity for wild-type, PHENOTYPE:
|

Comparison of color preference ranking and index between wild type, |

Comparison of short-term memory between wild type, PHENOTYPE:
|

STRING protein interaction networking analysis between the ( |

ZFIN is incorporating published figure images and captions as part of an ongoing project. Figures from some publications have not yet been curated, or are not available for display because of copyright restrictions. PHENOTYPE:
|
|
ZFIN is incorporating published figure images and captions as part of an ongoing project. Figures from some publications have not yet been curated, or are not available for display because of copyright restrictions. PHENOTYPE:
|
|
ZFIN is incorporating published figure images and captions as part of an ongoing project. Figures from some publications have not yet been curated, or are not available for display because of copyright restrictions. |