
- Title
-
Reactive oligodendrocyte progenitor cells (re-)myelinate the regenerating zebrafish spinal cord
- Authors
- Tsata, V., Kroehne, V., Wehner, D., Rost, F., Lange, C., Hoppe, C., Kurth, T., Reinhardt, S., Petzold, A., Dahl, A., Loeffler, M., Reimer, M.M., Brand, M.
- Source
- Full text @ Development

Oligodendrocyte numbers are transiently decreased and re-established after SCI. (A) mbp:eGFP+ oligodendrocyte somata (insets, red dots) and myelin sheaths (insets, yellow arrowheads) are reduced after SCI, but the population is re-established at 14 dpl. Images are maximum intensity projections of transverse sections. D, dorsal; V, ventral. In the overview images, a yellow asterisk indicates the central canal. Scale bars: 100 μm. (B) Stereological quantification of mbp:eGFP+ somata 350 µm rostral and caudal to the transection site shows a significant reduction in the number of oligodendrocytes at 7 dpl, compared to sham controls. Evidence of re-myelination is detected as early as 14 dpl (inset, yellow arrowheads). Data are mean±s.e.m. Numbers in the plots indicate the number of experimental animals. *P≤0.05 (Kruskal–Wallis followed by Dunn's multiple comparisons post-hoc test). Significance is shown compared to sham control. (C) Stereological quantification of mbp:eGFP+ cells at 7 dpl along the rostrocaudal (RC) axis and around the transection site shows a spatially restricted loss of myelinating oligodendrocytes. Data are mean±s.e.m. Numbers in the plots indicate the number of experimental animals. *P≤0.05 (Kruskal–Wallis followed by Dunn's multiple comparisons post-hoc test). Significance is shown compared to sham control. (D) TUNEL assay to detect dying cells at 4 hpl, 1 dpl and 2 dpl. Images are maximum intensity projections of transverse sections. D, dorsal; V, ventral. In the overview images, a white asterisk indicates the central canal. Scale bars: 5 μm in insets; 100 μm in overviews. (E) TUNEL+ cells were significantly increased at 1 dpl compared to sham controls. Data are mean±s.e.m. Numbers in the plots represent experimental animals. **P≤0.01 (Kruskal–Wallis test followed by Dunn's multiple comparisons post-hoc test). Significance is shown compared to sham control. (F) The number of mbp:eGFP+/TUNEL+ |
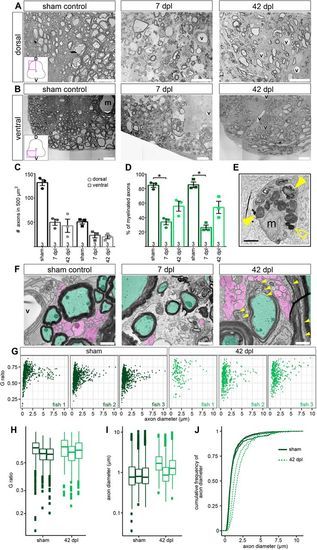
SCI results in axonal and myelin sheath loss, and different myelin patterns between individual fish. (A,B) Myelinated and non-myelinated axons are decreased after SCI. Overview images are TEM images of transverse sections. D, dorsal; V, ventral (m, Mauthner axon; v, blood vessel). Scale bars: 20 µm. (C) Quantification of axons in a 500 µm2 area after SCI. Data are mean±s.e.m. Numbers in the plots indicate the number of experimental animals. (D) Percentage of myelinated axons after SCI. Data are mean±s.e.m. Numbers in the plots indicate the number of experimental animals. *P≤0.05 (Kruskal–Wallis followed by Dunn's multiple comparisons post-hoc test). Significance is shown compared to sham control. (E) Macrophage/microglia engulfing myelin debris (filled yellow arrowheads) and lipid droplets (empty yellow arrowhead). Scale bar: 1 μm. (F) SCI results in thinner/still forming myelin sheaths after (re-)myelination. Axons are pseudo-coloured (green, myelinated; magenta, non-myelinated; yellow arrowheads, newly formed myelin sheaths; v, blood vessel). Images are TEM close-ups of transverse sections. Scale bars: 1 µm. (G) G-ratio over axon diameter for all individual fish investigated from the sham control and the 42 dpl group. Each dot represents an axon. (H) G-ratio analysis of all individual fish investigated from the sham control (dark green) and 42 dpl group (light green). Data are presented as box-and-whisker plots, each box presents one of the individual fish shown in G (150-1524 axons were measured per fish). (I) Axon diameter of all individual fish investigated from sham control and 42 dpl group. Data are presented as in H. (J) Cumulative frequency of axon diameter of myelinated axons in sham controls and at 42 dpl. |
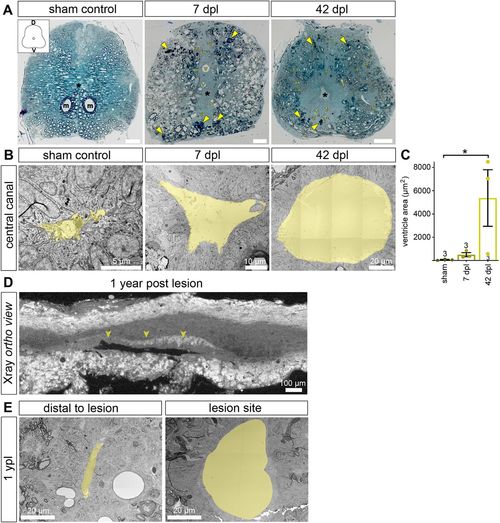
SCI results in altered tissue architecture close to the transection site that persists at 1 ypl. (A) Semi-thin transverse spinal cord sections stained with Toluidine Blue/borax to visualize membranes. Sections at 7 dpl and 42 dpl come from the rostral part of the lesion site, and ∼50 μm from the transection site. In the overview images, a black asterisk indicates the central canal (m, Mauthner axon; v, blood vessel). D, dorsal; V, ventral. At 7 dpl, myelin debris is indicated by yellow arrowheads. At 42 dpl, tissue integrity is largely restored, yet tissue architecture does not return to its pre-injury characteristics. Vessels and ventricular area remain markedly increased. Scale bars: 50 µm. (B,C) SCI results in an increase in the area of the central canal that persists at 42 dpl. Images are TEM close-ups of transverse spinal cord sections. The central canal is pseudo-coloured (yellow). Data are mean±s.e.m. Numbers in the plots indicate the number of experimental animals.*P≤0.05 (Kruskal–Wallis followed by Dunn's multiple comparisons post-hoc test). Significance is shown compared to sham control. (D) X-ray microtomography (XμCT) to identify the lesion site at 1 ypl. Shown is an optical section of the orthogonal view after the scan was reconstructed as a TIFF stack. The position of the lesion site (including the transection site) was determined based on the size of the ventricle along the anterior-posterior axis of the spinal cord. (E) The area of the central canal at the lesion site remains increased at 1 ypl when compared with sites distal to the transected area (n=2). Images are TEM close-ups of transverse spinal cord sections. The central canal is pseudo-coloured (yellow). |
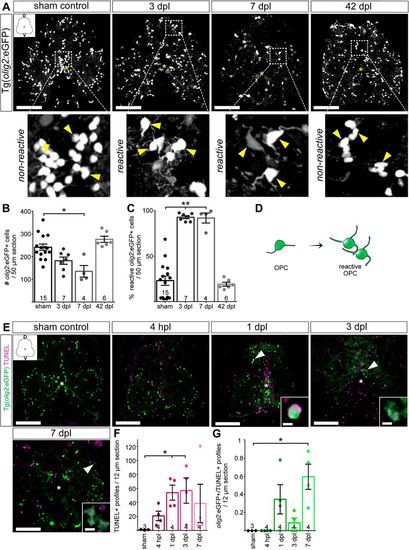
OPCs undergo distinct morphological changes after spinal cord transection. (A) The morphology of parenchymal OPCs (enlargements, yellow arrowheads) changes as cells enter a ‘reactive’ state immediately after SCI. Changes are indicated by marked increase in their cell size and the extension of long multi-branched processes. Activation features persist at 7 dpl and return to control levels at 42 dpl. Images are maximum intensity projections of transverse sections. D, dorsal; V, ventral. In the overview images, a yellow asterisk indicates the central canal. Scale bars: 100 µm. (B) Stereological quantification of parenchymal olig2:eGFP+ cells 700 µm around the transection site shows a significant reduction in OPCs at 7 dpl, compared to sham controls. Data are mean±s.e.m. Numbers in the plots indicate the number of experimental animals. *P≤0.05 (Kruskal–Wallis test followed by Dunn's multiple comparisons post-hoc test). Significance is shown compared to sham control. (C) At 3 and 7 dpl, the percentage of reactive cells is significantly increased between lesioned and sham control animals. Data are mean±s.e.m. Numbers in the plots indicate the number of experimental animals. **P≤0.01 (Kruskal–Wallis test followed by Dunn's multiple comparisons post-hoc test). Significance is shown compared to sham control. (D) Schematic representation of morphological changes indicating activation features of reactive OPCs after SCI. (E) TUNEL assay to detect dying cells at 4 hpl, 1 dpl, 3 dpl and 7 dpl. Images are maximum intensity projections of transverse sections. D, dorsal; V, ventral. In the overview images, a white asterisk indicates the central canal. Scale bars: 5 µm in insets; 100 µm in overviews. (F) TUNEL+ cells were significantly increased at 1 and 3 dpl, compared to sham controls. Data are mean±s.e.m. Numbers in the plots indicate the number of experimental animals. *P≤0.05 (Kruskal–Wallis test followed by Dunn's multiple comparisons post-hoc test). Significance is shown compared to sham control. (G) A significant increase in the number of dying olig2:eGFP+/TUNEL+ cells was detected at 7 dpl. However, the number of olig2:eGFP+/TUNEL+ cells remains below 1 cell per section at all investigated time-points. Data are mean±s.e.m. Numbers in the plots indicate the number of experimental animals. *P≤0.05 (Kruskal–Wallis test followed by Dunn's multiple comparisons post-hoc test). Significance is shown compared to sham control. |
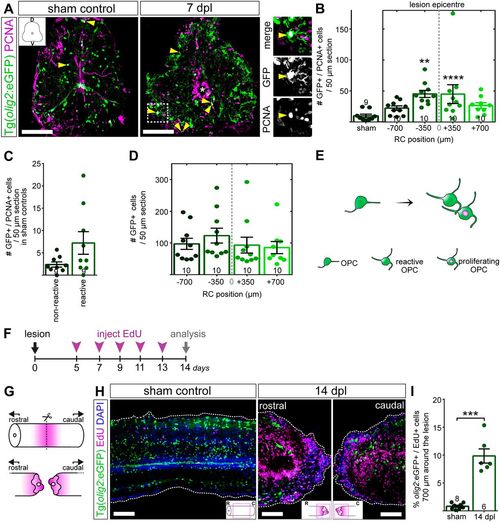
OPCs increase proliferation after SCI. (A) At 7 dpl, proliferating olig2:eGFP+/PCNA+ OPCs can be detected both in the parenchyma and the ventricle (overview/inset, yellow arrowheads). Images are maximum intensity projections of transverse sections. D, dorsal; V, ventral. In the overview images, a white asterisk indicates the central canal. Scale bars: 100 µm. (B) Stereological quantification of parenchymal olig2:eGFP+/PCNA+ cells 700 µm around the transection site shows a significant increase in proliferating OPCs at 7 dpl, compared to sham controls. Data are mean±s.e.m. Numbers in the plots indicate the number of experimental animals. ****P≤0.0001; **P≤0.01 (Kruskal–Wallis test followed by Dunn's multiple comparisons post-hoc test). Significance is shown compared to sham control. (C) Stereological quantification of parenchymal olig2:eGFP+/PCNA+ cells 700 µm around the transection site in sham controls shows that both non-reactive and reactive OPCs proliferate. (D) Stereological quantification of parenchymal olig2:eGFP+ cells 1400 µm around the transection site at 7 dpl shows no significant difference in the GFP+ cells along the RC axis (Kruskal–Wallis test followed by Dunn's multiple comparisons post-hoc test). (E) Schematic representation of OPCs becoming reactive immediately after lesion and proliferating. (F) Timeline of EdU labelling experiment to monitor generation of new OPCs. (G) Strategy to image and analyse OPC proliferation in whole-mount tissue after SCI and tissue clearance. (H) Optical section of whole-mount zebrafish spinal cord of transgenic Tg(olig2:eGFP) fish after CUBIC-based tissue clearance. At 14 dpl, the size of the ventricle is markedly increased (see also Fig. 4), while proliferation of both parenchymal and ventricular cells is upregulated. Scale bars: 100 µm. (I) Quantification of the percentage of olig2:eGFP+/EdU+ parenchymal OPCs 700 µm around the transection site after 3D-reconstruction in Imaris shows a significant increase in the percentage of newly generated OPCs at 14 dpl, compared to sham controls. Data are mean±s.e.m. Numbers in the plots indicate the number of experimental animals. ***P≤0.001 (Mann–Whitney test). Significance is shown compared to sham control. |
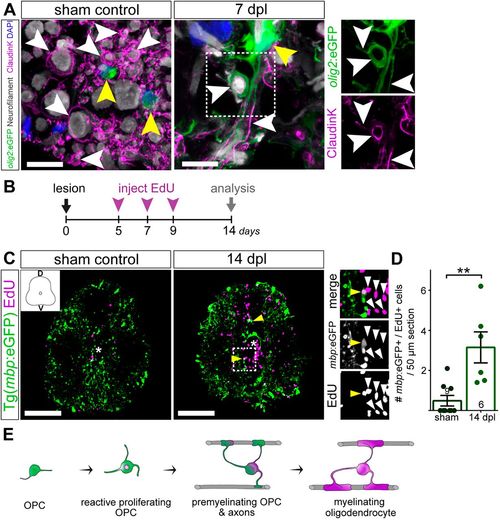
Generation of new oligodendrocytes after SCI. (A) Immunostaining for Claudin K (magenta; labelling oligodendrocytes and myelin sheaths) and Neurofilament (grey; labelling axonal filaments) in Tg(olig2:eGFP) sham and 7 dpl fish. In sham controls, OPCs are small and round (sham control, yellow arrowheads) and myelin sheaths enwrap axons in a highly organized manner. SCI results in marked axonal loss and in OPCs becoming reactive (7 dpl, yellow arrowheads). At the same time-point, a proportion of reactive OPCs which is in contact with axons are Claudin K+, indicative of their differentiation into myelinating oligodendrocytes. Images are maximum intensity projections of transverse sections. Scale bars: 10 µm. (B) Timeline of EdU labelling experiment to monitor newly generated oligodendrocytes. (C) SCI causes an increase of newly generated cells (insets, white arrowheads) 700 µm around the lesion site from 5 to 14 dpl. Newly generated oligodendrocytes (mbp:eGFP+/EdU+) can be detected in all areas of the lesioned spinal cord (overview/insets, yellow arrowheads). Images shown are maximum intensity projections of transverse sections. D, dorsal; V, ventral. In the overview images, a white asterisk indicates the central canal. Scale bars: 100 µm. (D) Stereological quantification of mbp:eGFP+/EdU+ cells 700 µm around the lesion site shows a significant increase in the number of newly generated oligodendrocytes at 14 dpl compared to sham controls. Data are mean±s.e.m. Numbers in the plots indicate the number of experimental animals. **P≤0.01 (Mann–Whitney test). Significance is shown compared to sham control. (E) Schematic representation of OPC myelination at 7 dpl and generation of oligodendrocytes by 14 dpl. A proportion of reactive OPCs becomes pre-myelinating, providing fast myelination of spared axons. |
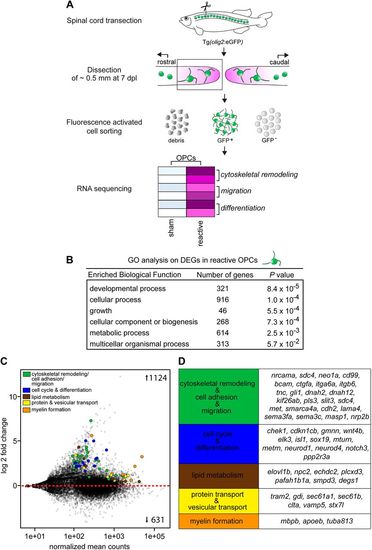
Reactive OPCs upregulate genes involved in differentiation and myelin formation. (A) Experimental pipeline to investigate the transcriptional profile of reactive OPCs with RNAseq. The spinal cord of adult zebrafish is transected. At 7 dpl, ∼0.5 mm of spinal cord tissue (rostral part) is dissected. For sham control fish, a ∼0.5 mm tissue is dissected at the same area of the spinal cord along the rostral to caudal axis of the fish. A calcein AM dye step is used to stain for viable cells. olig2GFP+/calcein+ OPCs are FAC sorted and processed for the preparation of an RNAseq library. DEGs between lesioned (reactive OPCs) and sham control (non-reactive) groups are analysed. (B) Gene ontology (GO) analysis on DEGs in reactive versus non-reactive OPCs at 7 dpl revealed enrichment for processes involved in development, growth, biogenesis and metabolism. (C) Plot of mean normalized counts over fold-change in reactive versus non-reactive OPCs of DEGs at 7 dpl. Each dot represents a gene. (D) Genes were selected based on their functional annotation to processes involved in myelination. |
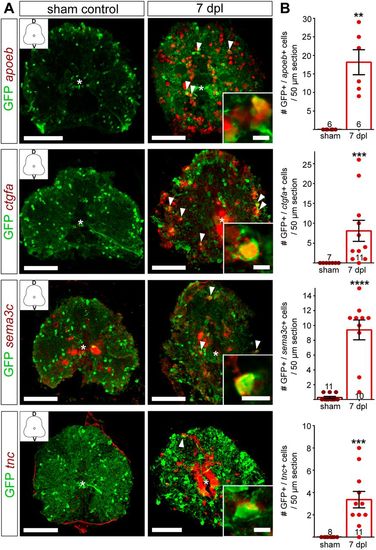
Validation of RNAseq candidate genes with fluorescent in situ hybridization. (A) Fluorescent in situ hybridization for apoeb, ctgfa, sema3c and tnc in Tg(olig2:eGFP) fish. SCI results in gene expression upregulation (red) in the spinal cord parenchyma (ctgfa, tnc, sema3c and apoeb) and in the central canal (ctgfa and tnc) at 7 dpl. Sections were co-stained using anti-GFP antibody. Overview images are maximum intensity projections of transverse sections. D, dorsal; V, ventral. In the overview images, a white asterisk indicates the central canal. Scale bars: 10 μm in insets; 100 μm in overviews. (B) Quantification of mRNA+/GFP+ cells in 50 µm sections, 350 µm rostral to the lesion site shows a significant increase in the number of OPCs upregulating the respective gene at 7 dpl, compared to sham controls. Data are mean±s.e.m. Numbers in the plots indicate the number of sections counted. Number of experimental animals were as follows: six sham control and six lesioned for apoeb, ctgfa and tnc; eight sham and eight lesioned for sema3c. **P≤0.01; ***P≤0.001; ****P<0.0001 (Mann–Whitney test). Significance is shown compared to sham control. |
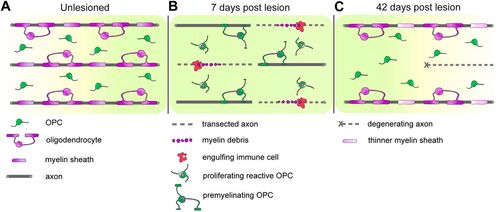
Contribution of reactive OPCs to zebrafish spinal cord regeneration. (A) In the unlesioned spinal cord, oligodendrocytes ensheath axons and OPCs have thin bipolar processes. Non-myelinated axons and other cell types are omitted for figure clarity. (B) Oligodendrocytes are lost acutely upon lesion, but cellular debris is removed by activated immune cells. OPCs become reactive, proliferate and systemically upregulate genes related to differentiation. A proportion of reactive OPCs becomes pre-myelinating, directly supporting spared axons. (C) Both oligodendrocyte progenitor and oligodendrocyte cell numbers are re-established. At 42 dpl, (re-)myelination is not fully completed, with myelin sheaths that are as yet thinner, compared to pre-injury levels. Some axons are degenerating, while others are still non-myelinated. Nevertheless, partial anatomical and molecular recovery is already sufficient to support the previously reported robust functional recovery at this point in time after lesion (Becker et al., 1997). |