
- Title
-
Vitamin E deficiency dysregulates thiols, amino acids and related molecules during zebrafish embryogenesis
- Authors
- Zhang, J., Head, B., Leonard, S.W., Choi, J., Tanguay, R.L., Traber, M.G.
- Source
- Full text @ Redox Biol.

Fig. 1. Embryos are similar sized at each stage with E− developmentally delayed. Live imaging of embryos was performed at each developmental stage used for assays and shows that embryos are of similar size, as measured by egg diameter, egg yolk diameter and estimated egg yolk volume. At 12 hpf, E+ embryos (A) develop normally indicated by 5–6 somites. At the same stage, E− embryos (B) are developmentally delayed with reduced somites (*) and smaller anterior head region. By 24 hpf, the otic vesicle is apparent, myotomes are neatly packed in V-shapes and the tail begins to extend in E+ embryos (C). In a representative E− embryo, however, the otic vesicle is less visible, posterior myotomes are loosely packed and the tail extension is reduced (D, *). E+ embryos at 48 hpf (E) show pigment migration dorso-laterally and have experienced the first heartbeat with visible circulation in the pericardium. E− embryos at the same stage (F) have greater incidence of both yolk sac and pericardial edema (*). (A-B) are taken with a 10× objective, (C–F) are taken with a 2× objective. Image was generated in Adobe Photoshop and any manipulations (contrast, saturation) were performed uniformly across images at the same developmental stage. |
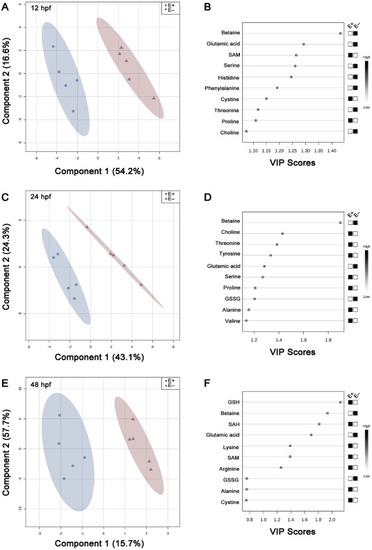
Fig. 2. Schematic representation of 2D PLS-DA scores plot and important features. Metabolite features and concentrations from embryos (E+ and E−; n = 5 per group per time point per analysis) were normalized and assessed by partial least squares – discriminant analysis (PLSDA). 2D score plots were produced to separate feature differences between E+ and E− embryos at (A) 12-, (C) 24-, and (E) 48 hpf. E+ is shown in blue, E− is shown in red with corresponding 95% confidence regions (CR) drawn around each sample group. Variable importance of projection (VIP) scores from Component 1 of each PLS model indicate the most important features separating E+ and E− embryos at (B) 12-, (D) 24-, and (F) 48 hpf. Black and white boxes to the right of the VIP score plot indicate relative concentrations of each metabolite between E+ and E− embryos at the given time point. |
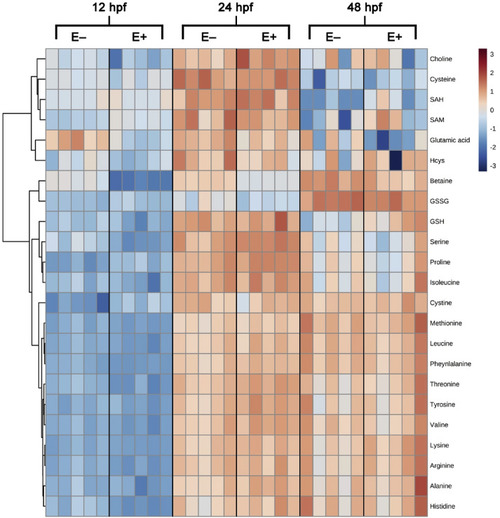
Fig. 3. Heatmap visualization of metabolite features and relative concentrations over time. Metabolite features and concentrations from embryos (E+ and E−; n = 5 per group per time point per analysis) were normalized by log transformation and auto scaling. Heatmap was generated with Ward clustering algorithm and separated by Euclidean distance. Map is arranged by VitE status and time point with all measured metabolite features shown. Colored box to the right of the map indicates relative concentration of metabolite between E+ and E− embryos across all time points. Heatmap dendrogram separated primarily into two clusters by relative metabolite concentration: cluster one contains choline, cysteine, SAH, SAM, glutamic acid, and homocysteine with all other metabolites measured in cluster two. Cluster two is further separated by three family groups; one group contains betaine and GSSG, one group contains GSH, serine, proline and isoleucine, and one group contains the remaining 11 metabolites, which are primarily amino acids. |

Fig. 4. Quantitative analysis of thiols, amino acids and related substances, Y-axes vary according to the concentration of each compound (pmol/embryo), X-axes shown times as 12, 24 and 48 hpf. Embryos (E+, E− or control; n = 5 per group per time point per analysis) were analyzed either by the AA protocol (choline, betaine, SAM, SAH, methionine, serine and glutamate) and the thiol protocol (homocysteine, cysteine, cystine, GSH and GSSG). Data shown are pmol/embyro (mean ± SEM) at 12, 24 and 48 hpf. Symbols denote significant differences, as determined by Tukey post-hoc comparisons, at the time interval shown: E+ vs E− ‡P ≤ 0.05, ‡‡P ≤ 0.01, ‡‡‡P ≤ 0.001, ‡‡‡‡P ≤ 0.0001; control vs E− *P ≤ 0.05, **P ≤ 0.01, ****P ≤ 0.0001; control vs E+ #P ≤ 0.05, ##P ≤ 0.01, ###P ≤ 0.001. (A) Choline (Interaction, P = 0.0670, Time P < 0.0001, Group P = 0.7725), (B) Betaine (Interaction, P < 0.0001, Time P < 0.0001, Group P < 0.0001), (C) SAM (Interaction, P = 0.2115, Time P < 0.0001, Group P = 0.0666), (D) Homocysteine (Interaction, P = 0.3539, Time P = 0.0802, Group P = 0.4504), (E) Methionine (Interaction, P = 0.3661, Time P < 0.0001, Group P = 0.7944), (F) SAH (Interaction, P = 0.0405, Time P < 0.0001, Group P = 0.0271), (G) Serine (Interaction, P = 0.0357, Time P < 0.0001, Group P = 0.4039), (H) Cystine (Interaction, P = 0.7759, Time P < 0.0001, Group P < 0.0001), (I) Cysteine (Interaction, P = 0.1655, Time P < 0.0001, Group P = 0.2320), (J) GSH (Interaction, P < 0.0001, Time P < 0.0001, Group P < 0.0001), (K) Glutamate (Interaction, P = 0.2791, Time P < 0.0001, Group P = 0.0001), (L) GSSG (Interaction, P = 0.0977, Time P < 0.0001, Group P = 0.0622). |