FIGURE SUMMARY
Title

E-cadherin focuses protrusion formation at the front of migrating cells by impeding actin flow

Authors
Grimaldi, C., Schumacher, I., Boquet-Pujadas, A., Tarbashevich, K., Vos, B.E., Bandemer, J., Schick, J., Aalto, A., Olivo-Marin, J.C., Betz, T., Raz, E.
Source
Full text @ Nat. Commun.

E-cadherin is required for germ cell directionally persistent migration track.

a Graph: PGC migration speed and directional persistence in e-cadherinweg/weg embryos relative to control embryos. n = number of cells from 4 independent experiments. Right: representative tracks of PGCs migrating within e-cadherin+/+ and +/weg embryos or e-cadherinweg/weg embryos. b Graph: PGC migration speed and directional persistence in e-cadherin-morpholino-treated embryos relative to control embryos. n = number of cells from 4 independent experiments. Right: representative tracks of PGCs migrating within embryos injected with either a control or e-cadherin morpholino. c Graph: migration speed and directional persistence of PGCs expressing a dominant-negative form of E-cadherin as compared with control cells. n = number of cells from 3 independent experiments. Right: representative tracks of cells expressing a control protein or a dominant-negative form of E-cadherin. The results presented in ac were derived from time-lapse movies captured between 6 and 8 hours post fertilization (hpf) at a time interval of 2 min between frames. The tracks are presented as 2-dimensional Z-projection of the 3-dimensional data acquired. Cells were tracked for 70 min and analyzed using Imaris software. Additional representative tracks are provided in Supplementary Fig. 1a. Normalized mean ± s.e.m.; P value: two-tailed Mann–Whitney U-test; ns = not significant. d Graph: number of cells that reside out of the developing gonad region at 22 hpf. Mean ± s.e.m.; P value: two-tailed Mann–Whitney U-test; N = number of embryos from 3 independent experiments. Right: Dashed yellow line indicates the developing gonad region, which spans the first half of the yolk extension; yellow arrows point at ectopic cells; scale bars, 150 μm. Source data are provided as a Source Data file.

Effect of E-cadherin depletion on actin distribution and dynamics within migrating PGCs.

a Color-coded actin (LifeAct-EGFP) fluorescence intensity in a control cell (upper panel) and in an E-cadherin-depleted cell (lower panel). White arrows indicate the migration direction; scale bars, 10 μm. Cells are derived from the same data sets presented in b and in Supplementary Fig. 4a, b. b Left panel: schematic illustration of the division of the cell into 5 domains employed in the quantitation presented on the right. The ratio between the mean value of LifeAct-EGFP signal in segment 1 (F, front) and that in segment 3 (M, middle) was calculated. Graphs: F/M ratios for control cells and E-cadherin-depleted cells (e-cadherinweg/weg mutants (left graph), e-cadherin morpholino-injected embryos (middle graph), and DN E-cadherin-expressing PGCs (right graph)). n = number of cells from 5 independent experiments for e-cadherinweg/weg mutants and 4 independent experiments for the other conditions; mean ± s.e.m.; P value: two-tailed Mann–Whitney U-test. Data derived from the same sets of cells analyzed in Supplementary Fig. 4a, b. c, d Upper panels: representative polarized PGCs (control cells and cells treated with either e-cadherin morpholino (c) or DN E-cadherin (d)) expressing LifeAct-EGFP. White arrows indicate the direction of migration; scale bars, 10 μm. Lower panels: kymographs along the yellow lines in the upper panels. Yellow stars mark the starting position on the cell border where kymograph measurements were conducted (see Methods for further details). Scale bars, x = 5 μm, t = 12 s (s = seconds). Graphs: actin velocity values at the cell front derived from the kymographs. n = number of velocities from 8 independent experiments for morphants (c) and 6 independent experiments for DN E-cadherin (d); mean ± s.e.m.; P value: two-tailed Mann–Whitney U-test. e Upper schematics: representative shape of a polarized PGC before (left) and after (right) bleb initiation. Black arrows indicate the direction of migration. Dotted rectangles mark the regions of the cell front, which are magnified in the panels below. Lower panels: Color-coded arrows represent the direction of flow of cytoplasm (cytosolic EGFP) and actin (LifeAct-mCherry) at the cell front of a representative migrating PGC before (left, purple panels) and during bleb (right, green panels). For both channels, the arrows indicating the flow are placed on top of the cell contour derived by edge detection for the cytoplasmic signal (gray background). The partial snapshots are derived from the time points 6.0 s and 12.5 s in the Supplementary Movie 2. Cytoplasmic EGFP: red = 44.4 μm min−1; blue = 0.0 μm min−1. LifeAct-mCherry: red = 46.8 μm min−1; blue = 0.0 μm min−1. Black arrow indicates the direction of migration; scale bar, 5 μm. f Measurements of actin velocity along the cell perimeter performed using the BioFlow software (see Methods). Snapshot: the length of the cell contour was divided into four equal parts with an average width of 1.7 μm. The mean actin velocity values along the cell front-rear axis within these regions were calculated for 10 s prior to bleb formation. The presented snapshot corresponds to an example control cell: red = 28.2 μm min−1; blue = 0.0 μm min−1. Scale bar = 5 μm. Tables: black and red arrows indicate the direction of actin movement with respect to the cell front-rear axis. Values indicate mean ± s.e.m. Data are derived from the same sets of cells analyzed in c, d. Source data are provided as a Source Data file.

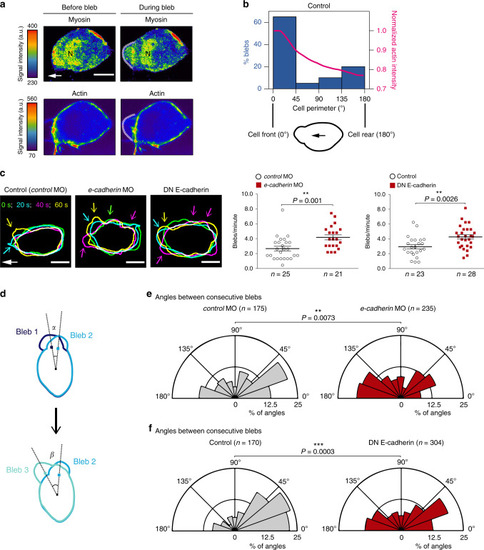
Myosin distribution in migrating PGCs and changes in the polarized generation of blebs upon E-cadherin knockdown.

a Snapshots showing the distribution of myosin (Myl12.1-EGFP) and actin (LifeAct-mCherry) in a polarized PGC before and during bleb formation (see Supplementary Fig. 7a for an additional example). The snapshots are derived from Supplementary Movie 4, cell1, time points 0 s (before bleb) and 8 s (during bleb). White arrow indicates the direction of migration; N = myosin nuclear localization that might reflect a possible function of the protein in the nucleus (as described for human Myl12a also known as MRLC362); a.u. = arbitrary units; scale bars, 10 μm. The experiment was repeated three times. b Graph: percentage of blebs initiating at different angles around the cell perimeter (left y-axis, blue columns) and normalized actin intensity (right y-axis, magenta line) of Control cells (for cells expressing the DN E-cadherin and analyzed in a similar way see Supplementary Fig. 8c). The schematics shows the cell perimeter of a polarized PGC where 0° represents the cell front and 180° the cell rear. The black arrow indicates the direction of migration. A total number of 4 representative cells and 20 blebs were analyzed. c Left panels: overlays of the cell contours of three representative polarized PGCs at four time points, presenting bleb formation over 60 s. Time points are color-coded as indicated. Colored arrows point at blebs formed at time points of the corresponding colors. White arrow indicates the direction of migration; scale bars, 10 μm; s = seconds. The cell contours are derived from the movies in Supplementary Movie 6 (control MO: 0, 20, 40, 60 s; e-cadherin MO: 20, 40, 60, 80 s; DN E-cadherin: 15, 35, 55, 75 s). Graphs present the number of blebs per minute in polarized, motile PGCs. n = number of cells from 6 and 5 independent experiments for e-cadherin morpholino experiments and DN E-cadherin experiments, respectively; mean ± s.e.m.; P value: two-tailed Mann–Whitney U-test for morpholino and two-sided Student’s t-test for DN E-cadherin. d Schematics explaining the measurements provided in e and f. The angles between consecutive blebs were derived by measuring the angle between the two lines that connect the centre of the cell with the point of bleb initiation at a certain time point (for example, time point 1, bleb 1) and the site of initiation of the next bleb (for example, time point 2, bleb 2). e, f Polar plots show the distribution of angles between consecutive blebs in control cells (gray polar plots) and cells with manipulated E-cadherin function (red polar plots). n = number of angles obtained from 7 independent repeats for morpholino experiments (26 cells for control MO and 24 cells for e-cadherin MO) and 6 independent repeats for the DN E-cadherin experiments (23 cells for Control and 31 cells for DN E-cadherin). The time-lapse videos for characterizing blebbing were captured at 500 ms time intervals. P values: two-tailed Kolmogorov–Smirnov test. Source data are provided as a Source Data file.

A model for the function of E-cadherin in sustaining polarized formation of protrusions in bleb-based migration.

a, b Actomyosin enrichment (magenta gradient) at the front of migrating cells promotes bleb initiation either by causing breaks within the actin cortex or by detaching the cortex from the plasma membrane. Accordingly, the region of the cell front containing a high level of actomyosin is more prone to subsequent blebbing (bleb-prone region, BPR). Myosin-dependent contractility also generates a contractile force (Fcontractility) that results in retrograde cortical flow, together with the actomyosin-rich structure present at the cell front (Actin flow velocity v, black arrow). In wild-type cells, actin in PGCs is coupled to that in surrounding cells via E-cadherin; this coupling restricts the bleb-prone region at the leading edge by frictional forces resisting the actomyosin-driven flows (γwt, wild-type). Upon a depletion of E-cadherin (E-cadherin knockdown scenario), the friction opposing the actin retrograde flows (γKD) is lower. As a result, the bleb-prone region spreads towards the back of the cell, and blebbing events occur in a less coordinated manner. The shape of the spread can be predicted by a transport-decay model to be an exponential function, where λ is a characteristic length that depends inversely on the friction γ, and IBG is the background fluorescence. (For more details on the mathematical modelling, see Methods). c Exponential fits of the actin fluorescence intensity in the PGCs derived from the signal profiles shown in Supplementary Fig. 4a, d upon decreasing the actin to membrane linkage by the expression of DN E-cadherin or β-catenin mutant (for the fits of e-cadherinweg/weg mutant and e-cadherin MO see Supplementary Fig. 9). As predicted by the transport-decay model, in each case the decay length of E-cadherin knockdown (λKD) is larger than in the control (λwt) situation: λKD > λwt. This suggests that the overall actin polarity is reduced when the friction with the environment is reduced.

Behavior of migrating PGCs upon interaction with cellular domains expressing different levels of E-cadherin.

a Schematic representation of the experiments presented in the figure. Cell clones were generated by injecting fluorescently labeled morpholinos (green) and RNAs into one out of 32 blastomeres. The germ cells expressed LifeAct fused to mCherry. Embryos containing the labeled transplant were imaged between 7 and 9 hpf using light-sheet microscopy. The right panels show an example of a polarized PGC that migrates from the non-manipulated area (black) and contacts a MO-treated clone (green). Scale bar, 10 μm; white arrow in the inset indicates the direction of migration. bd Snapshots showing examples of the three types of behaviors observed upon contact between PGCs and MO-treated clones (e-cadherin MO in these cases): no reaction, change of polarity and loss of polarity (See Supplementary Movies 7, 8 and 9). The separate panels connected with dashed lines on the right provide magnifications of the cells (in c and d, rotated views are presented, with the direction of rotation indicated by the black curved arrows). White stars label the somatic cells contacted by the PGCs; white arrows indicate the direction of migration; min = minutes; t = 0 min indicates the moment of contact; yellow arrows point at the contact point; scale bars, 5 μm. Cells are derived from the same data sets presented in e. Snapshots in b correspond to time points 1 min, 2 min, 3 min (contact), 4 min, 5 min and 11 min in the Supplementary Movie 7. Snapshots in c correspond to time points 0 min, 1 min, 2 min, 3 min (contact), 4 min and 8 min in the Supplementary Movie 8. Snapshots in Fig. 5d correspond to time points 1 min, 2 min, 3 min (contact), 4 min, 5 min and 11 min in the Supplementary Movie 9. e Upper schematics explaining the generation of the two scenarios analyzed in the graph below. Graph: the percentage of PGCs showing no reaction (black striped columns) or change and loss of cell polarity (blue striped columns) upon contact with control clones or clones injected with e-cadherin MO. Mean ± s.e.m.; P value: two-tailed Mann–Whitney U-test; n = number of contact events from 6 independent experiments. Source data are provided as a Source Data file.

Acknowledgments
This image is the copyrighted work of the attributed author or publisher, and ZFIN has permission only to display this image to its users. Additional permissions should be obtained from the applicable author or publisher of the image. Full text @ Nat. Commun.