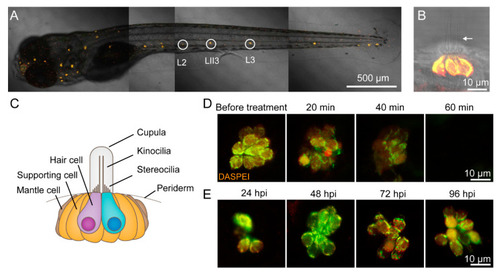
CuSO4 damages hair cells in the lateral line of zebrafish. (A) Lateral line hair cells in a 6 days postfertilization (dpf) wild-type AB zebrafish larva is labeled with 0.05% DASPEI. L2, LII3, and L3 neuromasts are marked with circles. Scale bar represents 500 μm. (B) The lateral view of a neuromast shows sensory hair cells in the center labeled with DASPEI and a bundle of kinocilia (arrow) extending out of the periderm. Scale bar represents 10 μm. (C) A cartoon illustrates the structure of the neuromast. (D) Time lapse imaging shows that when immersed in 5 μM CuSO4 solution, hair cells were gradually injured and damaged within 60 min. Scale bar represents 10 μm. (E) DASPEI staining displays that hair cells regenerate completely within 96 h postinjury (hpi). Scale bar represents 10 μm.

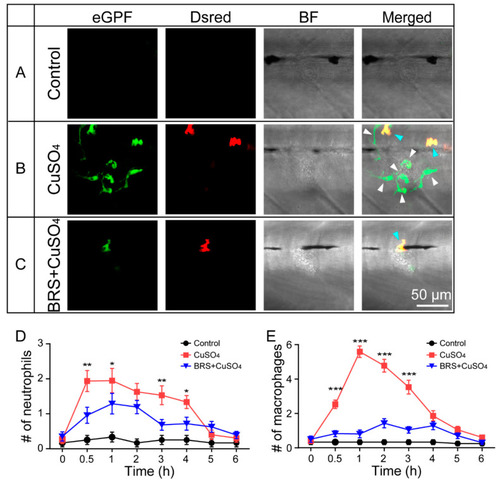
BRS-28 reduces the number of neutrophils and macrophages migrating to the injured neuromasts. (AC) Live imaging (40×) displays the regions of L3 neuromasts of larvae at the GFP channel, Dsred channel, and bright field (BF) channel and a superimposed image in different groups. Neutrophils (showing both green and yellow fluorescence, indicated by blue arrows) and macrophages (showing only green fluorescence, indicated by white arrows) around the neuromasts could be observed in Tg(coro1a:eGFP; lyz:Dsred2) larvae. They were almost entirely absent from the neuromasts in the control group (A). Many neutrophils and macrophages migrated to injured neuromasts in the CuSO4 group (B), while fewer neutrophils and macrophages migrated to injured neuromasts in the BRS+CuSO4 group (C). The image was captured after adding CuSO4 solution for 1 h. Scale bar represents 50 μm. (D,E) Line charts reveal decreased numbers of neutrophils (D) and macrophages (E) within a radius of 50 μm from the center of neuromasts at different time points after adding CuSO4 in the BRS+CuSO4 group (16 ≤ n ≤ 23) compared to the CuSO4 group (15 ≤ n ≤ 23). The control group (11 ≤ n ≤ 12) was observed at the same time points. The y-axis is a mean of multiple neuromasts (L2, LII3, and L3 neuromasts) from multiple zebrafish. The n values represent the numbers of neuromasts. In (D,E), the asterisk shows the difference between the CuSO4 group and the BRS+CuSO4 group. Comparisons were performed using two-way ANOVA, with Tukey’s multiple comparisons test. All error bars show mean ± S.E.M., *** p < 0.001, ** p < 0.01, * p < 0.05.

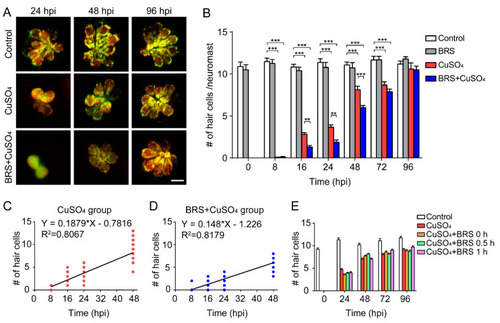
Suppressing inflammation delays hair cell regeneration. (A) Real-time imaging (40×) displays regenerated hair cells in the CuSO4 and BRS+CuSO4 group at 24, 48, and 96 hpi. The control group was imaged at the same time points. Scale bar represents 10 μm. (B) The numbers of regenerated hair cells were significantly lower in the BRS+CuSO4 group compared to the CuSO4 group at 16 (n ≥ 27, p < 0.01), 24 (n ≥ 21, p < 0.01), and 48 (n ≥ 24, p < 0.001) hpi. At 96 hpi, hair cells in both the CuSO4 group and the BRS+CuSO4 group had regenerated to normal levels. Linear analysis in the CuSO4 group (C) and BRS+CuSO4 group (D) was conducted on the number of regenerated cells within 48 hpi. The slope in the CuSO4 group (0.188) was higher than that in the BRS+CuSO4 group (0.148), and the x-intercept in the CuSO4 group (4.160) is higher than that in the BRS+CuSO4 group (8.287). (E) When the time window of inflammatory suppression was delayed, there was no delay in the regeneration of hair cells. BRS-28 was added at the same time as CuSO4 (CuSO4+BRS 0 h group), 30 min after the addition of CuSO4 (CuSO4+BRS 0.5 h group), or 1 h after the addition of CuSO4 (CuSO4+BRS 1 h group) (n ≥ 27 neuromasts at each time point of each group). For (B) and (E), comparisons were performed using two-way ANOVA, with Tukey’ multiple comparisons test. All error bars show the mean ± S.E.M., *** p < 0.001, ** p < 0.01.

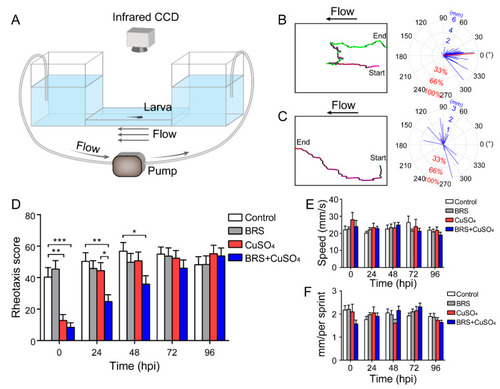
Assessment of rheotaxis reflects the function of the lateral line system. (A) A U-shaped tank was designed to test the rheotaxis behavior of larvae. A peristaltic pump was used to form the flow at the bottom of the tank. Larvae were placed in the right platform one by one, and they sensed the water flow from right to left. Rheotaxis was recorded by an infrared CCD. A larva with excellent rheotaxis (B) and a larva with poor rheotaxis (C) were analyzed by behavioral analysis software. Movement traces are plotted in the left panels, and the motion vectors are displayed in the right panels. The lengths of the blue segments represent the distance of each sprint, and the direction of the blue segment represents the direction of that sprint. The length of the red line segment is the ratio of the motion vectors’ sum to the motion arithmetic sum, and the direction is the direction of the sum of the vectors. (D) The rheotaxis score shows that at 0 hpi, both the CuSO4 and BRS+CuSO4 groups had poor rheotaxis. At 24 hpi, the rheotaxis of the BRS+CuSO4 group was significantly lower than that of the control group and CuSO4 group. Until 48 hpi, the rheotaxis score of the BRS+CuSO4 group was still significantly lower than that of the control group. On the contrary, the rheotaxis of the CuSO4 group was not significantly different from that of the control group within 24 hpi. n = 49, control group; n = 49, BRS group; n = 46, CuSO4 group; n = 47, BRS+CuSO4 group. The speed (E) and distance (F) of sprints were consistent across different times and between different groups. For (DF), comparisons were performed using two-way ANOVA, with Tukey’s multiple comparisons test. All error bars show the mean ± S.E.M., *** p < 0.001, ** p < 0.01, * p < 0.05.

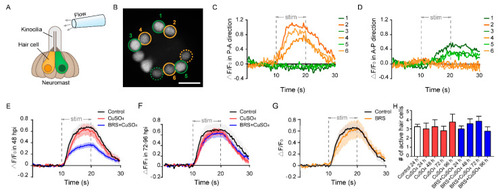
Calcium imaging reveals the function of a single neuromast. (A) The schematic diagram shows a glass micropipette filled with fluid located about 100 μm away from the top of kinocilia to stimulate the neuromast. The orange and green hair cells represent different polarities. (B) When stimulated by the flow, only a portion of hair cells responded in this focal plane (circled cells), and some were far from this focal plane (dashed circled cells). The No. 2, 4, and 6 active hair cells (orange circles) only responded to the flow in the P–A direction (C). At the same time, the No. 1, 3, and 5 active hair cells (green circles) only responded to the flow in the A–P direction (D). Scale bar in (B) represents 10 μm. (E) The relative fluorescence intensity change (ΔF/F0) of the BRS+CuSO4 group was significantly lower than that of the CuSO4 group in the Early Stage of regeneration (within 48 hpi) (p < 0.001). (F) ΔF/F0 of the BRS+CuSO4 group was not significantly different from that of the control group or CuSO4 group in the Late Stage of regeneration (72–96 hpi). (G) There was no difference in ΔF/F0 between the BRS group and the control group. (H) During the regeneration process, the numbers of active hair cells per neuromast in the CuSO4 and BRS+CuSO4 groups were basically the same and did not increase with the total number of regenerated hair cells. For (EH), comparisons were performed using one-way ANOVA, with Tukey’s multiple comparisons test.

Acknowledgments
This image is the copyrighted work of the attributed author or publisher, and ZFIN has permission only to display this image to its users. Additional permissions should be obtained from the applicable author or publisher of the image. Full text @ Biomolecules