
- Title
-
Prolonged podocyte depletion in larval zebrafish resembles mammalian focal and segmental glomerulosclerosis
- Authors
- Hansen, K.U.I., Siegerist, F., Daniel, S., Schindler, M., Iervolino, A., Blumenthal, A., Daniel, C., Amann, K., Zhou, W., Endlich, K., Endlich, N.
- Source
- Full text @ FASEB J.
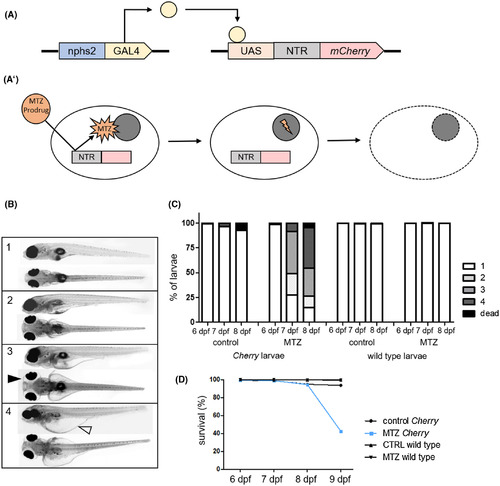
A, Schematically shows gene expression in the used transgenic zebrafish line. Gal4 is expressed under the nphs2 promotor. After binding to its specific recognition sequence UAS (upstream activation sequence), it activates the expression of a bacterial nitroreductase (NTR) and the red fluorescence protein mCherry. A′ shows a scheme of how MTZ is activated by NTR and subsequently induces DNA damage, which leads to apoptosis. B shows representative micrographs of 8 dpf zebrafish larvae to demonstrate the grading of developing edema after podocyte depletion. (1) no edema, (2) mild edema, (3) medium edema, and (4) severe edema. The black arrowhead exemplary indicates periocular edema, the blank arrowhead indicates abdominal edema. The graph in C shows relative distributions of phenotypes in n = 251 control‐treated and n = 275 MTZ‐treated Cherry larvae in four individual experiments and in n = 250 control‐treated and n = 250 MTZ‐treated wild‐type larvae. As visualized in the diagram in D, survival rates of podocyte‐depleted Cherry larvae are similar to controls until an abrupt decrease at 9 dpf PHENOTYPE:
|

ZFIN is incorporating published figure images and captions as part of an ongoing project. Figures from some publications have not yet been curated, or are not available for display because of copyright restrictions. |
|
ZFIN is incorporating published figure images and captions as part of an ongoing project. Figures from some publications have not yet been curated, or are not available for display because of copyright restrictions. PHENOTYPE:
|
|
ZFIN is incorporating published figure images and captions as part of an ongoing project. Figures from some publications have not yet been curated, or are not available for display because of copyright restrictions. |
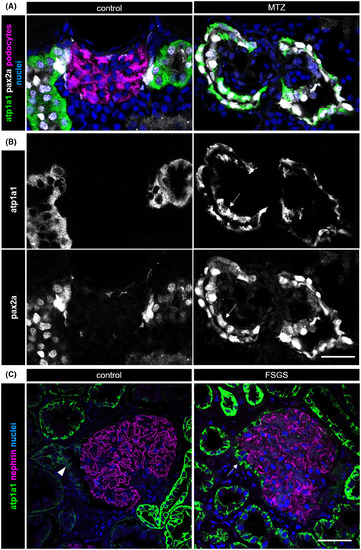
Co‐expression of atp1a1 and pax2a in proximal tubule cells of 9 dpf zebrafish larvae is shown in A. Panel B shows atp1a1 expression and pax2a expression separately. It is limited to the proximal tubule in control larvae; whereas in podocyte‐depleted larvae, it is also found in activated parietal epithelial cells and on the glomerular tuft (white arrows). The scale bar represents 20 µm. The micrographs in C exemplary show atp1a1 expression in a human glomerulus under healthy conditions, where it is limited to the tubule (white arrowhead), and in a patient with FSGS. Notice atp1a1 positivity of cells on the glomerular capillaries in FSGS, highlighted by the white arrow. Nephrin expression marks podocytes. The scale bar represents 50 µm |
|
ZFIN is incorporating published figure images and captions as part of an ongoing project. Figures from some publications have not yet been curated, or are not available for display because of copyright restrictions. PHENOTYPE:
|