FIGURE SUMMARY
Title

A phospho-switch controls RNF43-mediated degradation of Wnt receptors to suppress tumorigenesis

Authors
Tsukiyama, T., Zou, J., Kim, J., Ogamino, S., Shino, Y., Masuda, T., Merenda, A., Matsumoto, M., Fujioka, Y., Hirose, T., Terai, S., Takahashi, H., Ishitani, T., Nakayama, K.I., Ohba, Y., Koo, B.K., Hatakeyama, S.
Source
Full text @ Nat. Commun.

RNF43 function requires phosphorylation of a serine triplet.

ac Regulation of Wnt3a-mediated activation of Wnt/β-catenin signalling by RNF43 mutants was examined using SuperTopFlash (STF)-luciferase reporter assays. Luciferase activity in empty vector-transfected negative control (NC) cells was set to 1. SRR: serine rich region. Characters shown in red indicate amino acids after substitution (b, c). PA: protease-associated domain. TM: transmembrane region. RING: RING finger domain. d Expression of frizzled (Fzd) at the surface of RNF43 mutant-expressing cells was measured via flow cytometric analysis. FACS data was acquired and displayed with same strategy shown in Supplementary Fig. 1g. Grey or black lines, or grey fills indicate not stained, RNF43 stably expressed or mock cells, respectively. Expression in mock-transfected cells was set to 1. e Cellular phosphorylation of RNF43 was examined using 32Pi metabolic labelling. Radio-labelled RNF43 levels were normalised to total RNF43 protein levels. The relative phospho-RNF43 level in mock-transfected cells was set to 1. Bar graphs and error bars in this figure represent mean ± standard deviation (sd) of at least three biologically independent experiments. Red circles indicate individual values of each sample. The P values for the indicated comparisons were determined by one-way analysis of variance (ANOVA) (P < 0.05). n = 3 (ad), n = 4 (e) biologically independent samples. Asterisks or ND indicates significant or no significant difference in indicated comparisons, respectively.

Multi-step phosphorylation is required for RNF43 function.

ac The role of a priming phosphorylation was investigated using STF-Luc assay (a, c) and flow cytometric analysis (b) using RNF43 mutants. Luciferase activity or surface Fzd level in empty vector-transfected (NC) or mock cells was set to 1. Grey or black lines, or grey fills indicate not stained, RNF43 stably expressed or mock cells, respectively. Characters shown in red indicate amino acids after substitution (a, c). d Surface expression of Fzd was examined via flow cytometric analysis following addition of kinase inhibitors (GSK-3β, CHIR-99021; CK1, IC261). e, Phosphorylation of RNF43 and mutant forms was examined by an in vitro kinase assay with CK1/2. Phospho-RNF43 levels were normalised to total RNF43 protein levels and normalised phospho-RNF43(WT) levels were set to 1. f The effects of a loss of endogenous RNF43 (KO) or removal of the RNF43 phospho-switch (ΔPS; similar to serine-rich region (SRR)2 and SRR2-2 in Supplementary Fig. 1f) were examined in STF293 cells using a STF-luciferase assay. The luciferase activity in parental STF293 cells was set to 1. g Surface Fzd expression on RNF43 KO or ΔPS STF293 cells was evaluated using flow cytometry with pan-Fzd antibodies (Abs). h Schematic of localisation-dependent RNF43 activation via multi-step phosphorylation. RNF43 activity is acquired via phosphorylation at a post-ER stage during or after protein trafficking toward the cell surface. Bar graphs and error bars in this figure represent mean ± standard deviation (sd) of at least three biologically independent experiments. Red circles indicate individual values of each sample. The P values for the indicated comparisons were determined by one-way ANOVA (P < 0.05). n = 3 (ac, f), n = 4 (e) biologically independent samples. Asterisks or ND indicates significant or no significant difference in indicated comparisons, respectively. All FACS data in this figure was acquired and displayed with same strategy shown in Supplementary Fig. 1g. Each coloured line indicates the property of RNF43 expressing in cells (d, g).

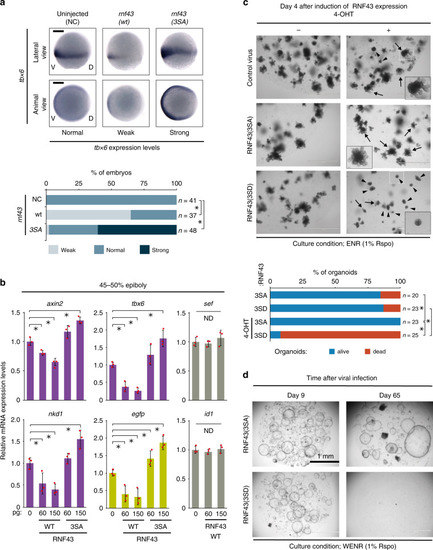
RNF43 phosphorylation regulates morphogenesis and ISC maintenance.

a Expression of endogenous target genes of Wnt/β-catenin signalling was evaluated using in situ hybridisation following expression of RNF43 phospho-mutant forms in zebrafish embryos at 8 h post-fertilisation (hpf) (75% epiboly). Scale bars, 200 μm. Asterisks indicate significant differences (P < 0.05, one-way ANOVA, n = 37–48 as indicated) from NC embryos. b Expression change of Wnt/β-catenin, FGF and BMP signalling target genes with RNF43 was evaluated using qPCR at 5.3 hpf (45–50% epiboly). Endogenous Wnt target genes, artificial Wnt reporter gene and non-Wnt target genes are shown in purple, green and grey, respectively. Expression of each gene in uninjected embryos was set to 1 (mean ± sd). Red circles indicate individual values of each sample. Asterisks indicate significant differences (P < 0.05, one-way ANOVA, n = 3, biological replicates with pools of 25–30 embryos) from uninjected embryos. ND indicates no significant difference. c Short-term development of intestinal organoids was examined at 4 days following induction of RNF43 phospho-mutant forms. White dashed boxes denote the area enlarged in black boxes. Arrows, healthy organoids. Arrowheads, dead organoids. Asterisks indicate significant differences (P < 0.05, one-way ANOVA, n = 20–25 as indicated) between groups. d Long-term ISC maintenance was evaluated after 65 days with two passages in organoids expressing RNF43 phospho-mutant forms. Scale bars in (c, d), 1 mm.

Active Ras cooperates with mutant RNF43 to induce tumorigenesis.

a Time-dependent tumour growth was examined in nude mice following expression of RNF43 phospho-mutant forms in NIH3T3 and Cle-H3 cells. Estimated tumour volume is shown. Red lines indicate RNF43(3SA)-expressing tumours. b Anchorage-independent colony-forming activity was evaluated via soft agar assay following the expression of RNF43 phospho-mutant forms in Cle-H3 cells. Scale bars, 100 μm. c Spheroid-forming activity was examined in Cle-H3 cells expressing RNF43 mutant forms. Spheroid formation was quantified via MTS assay. d Image of nude mice injected with Cle-H3-RNF43 cells. Scale bars, 1 cm. Tumour weight was measured at 5 wks following Cle-H3 injection. Graphs and error bars in this figure represent mean ± sd (c) or ± standard error of the mean (sem) (a, b, d) of independent experiments or samples. Red circles indicate individual values of each sample bd). The P values for the indicated comparisons in this figure were determined by one-way ANOVA (P < 0.05). n = 4–20 (a), n = 29–42 (b), n = 3 (c), n = 5–20 (d) biologically independent samples. Asterisks or ND indicates significant or no significant difference in indicated comparisons, respectively.

Cooperation of mutant RNF43 with active Ras establishes Wnt-Ras-p53 axis.

a Induction of p53 and p21 protein was examined by immunoblotting (IB) with Eto treatment. Expression of p53 and p21 in empty vector-transfected NC cells with DMSO treatment was set to 1. Bar graphs and error bars represent mean ± sd. Red circles indicate individual values of each sample. Asterisks indicate significant differences from NC cells stimulated with Eto (P < 0.05, one-way ANOVA, n = 3 biological replicates). ND indicates no significant difference. b, c Prognosis of patients with colorectal tumour that carry genetic mutations in RNF43 with or without KRAS (b) or in RNF43 with or without TP53 (c) is shown. Sample number and P value determined by log-rank test (b, c) with Holm adjustment for multiple comparisons (b) are indicated in each graph. d Schematic of biological role of RNF43 oncogenic mutations in multi-step tumorigenesis. Oncogenic RNF43 mutants that promote Wnt signalling and inhibit the p53 pathway cooperate with activating Ras mutations to complete all the steps of multi-step colorectal tumorigenesis.

Serine phosphorylation reverts oncogenic RNF43 to a tumour suppressor.

a The role of serine phosphorylation was examined using STF-Luc assay in an RNF43(R127P) mutant background. Luciferase activity in mock-transfected cells was set to 1 (mean ± sd). Schematic of RNF43 mutants used in Figs. 5, 6, Supplementary Fig. 7, 9 is shown. Independent values of each sample are shown as red circles. Asterisks indicate significant differences (P < 0.05, one-way ANOVA, n = 3 biologically independent samples) from RNF43(R127P) cells. b Colony-forming activity was evaluated following expression of RNF43 phospho-mutant forms in Cle-H3 cells via soft agar assay and volume of colonies was estimated. Scale bars, 100 μm. Asterisks indicate significant differences from RNF43(R127P) tumour. c Tumour growth was examined in nude mice with Cle-H3 cells following the expression of RNF43 phospho-mutant forms at 5 wks after Cle-H3 injection and tumour weight was measured. Images for all of the tumours are shown. Scale bar, 1 cm. NT indicates no tumour observed. Bar graphs and error bars in (b, c) represents mean ± sem of biologically independent samples. Red circles indicate individual values of each sample. The P values for the indicated comparisons were determined by one-way ANOVA (P < 0.05). n = 98–134 (b), n = 6–12 (c) biologically independent samples. Asterisks or ND indicates significant or no significant difference in indicated comparisons, respectively. d Ubiquitination of Fzd5 by RNF43 phospho-mutants was examined with bafilomycin A1 by immunoprecipitation (IP)-IB experiments. e Schematic of molecular mechanism and biological role of RNF43 phosphorylation in Wnt signalling and multi-step tumorigenesis. Wild-type RNF43 is activated by serine phosphorylation. Oncogenic RNF43 with R127P extracellular mutation is reverted to a functional tumour suppressor via the introduction of phosphomimetic mutation.

Acknowledgments
This image is the copyrighted work of the attributed author or publisher, and ZFIN has permission only to display this image to its users. Additional permissions should be obtained from the applicable author or publisher of the image. Full text @ Nat. Commun.