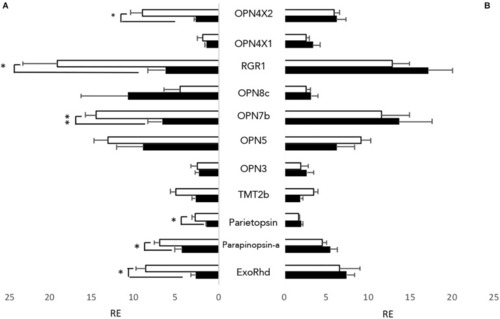
Non-visual opsins expressed in zebrafish cell lines. All 32 non-visual opsins were explored by RT-qPCR in entrained zebrafish cell lines at opposite times of day; ZT3 (white) and ZT15 (black). 11 opsins showed detectable expression levels, using a cut-off value of <Cq 30. (A) Opsins expressed in PAC2 cell lines. (B) Opsins expressed in clockDN cell lines. Opsin expression is plotted relative to the lowest detectable opsin, with error bars depicting SEM. An unpaired students t-test was used to assess if the opsins expressed show a time of day specific expression pattern. p < 0.05 and ∗∗p < 0.001 (n = 4).

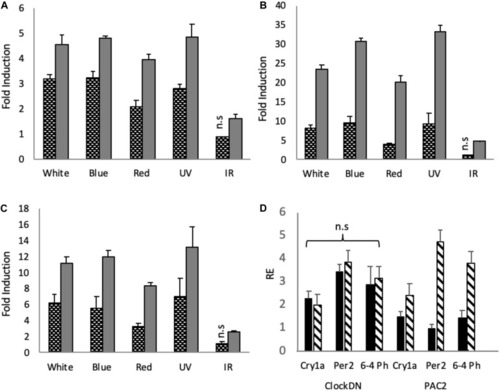
Light induction by monochromatic light-pulses in PAC2 and clockDN cell lines. Zebrafish cell lines were maintained on a 12:12 light-dark cycle before being given a 3-hour light pulse of varying wavelengths. Black and white bars represent clockDN cell line expression, whilst solid grey represent PAC2 cell line expression. (A) Light induction of cry1a. (B) Light induction of per2. (C) Light induction of 6–4 Photolyase. (A–C) is plotted as fold induction relative to dark control. (D) Dark controls (black bars) vs. IR monochromatic light pulse (striped bars) plotted relative to lowest expressed gene (PAC2 per2 DD) in clockDN and PAC2 cells. Significance was addressed with an one-way ANOVA (α = 0.05) for each light-pulse, cell line and gene, followed by a Bonferroni post-test. All light pulses give a significant increase of p < 0.05 unless marked on the graph (n = 3).

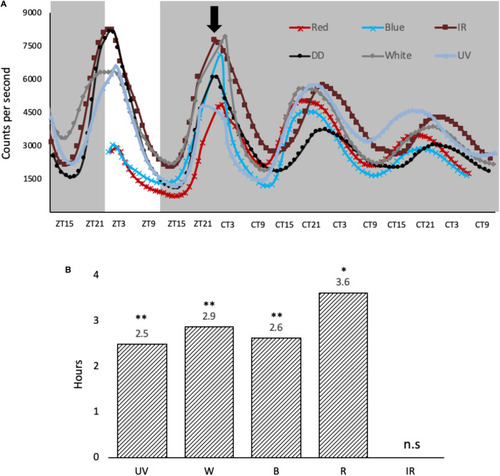
Light-induced phase shifts in response to monochromatic light-pulses in per1-luciferase zebrafish cells. (A) Cells were entrained for 3 days on a 12:12 LD cycle, before they were given a variety of monochromatic light pulses at ZT21, denoted by black arrow. The cells were kept in constant dark over two subsequent days. (B) Light pulses cause a phase advance in hours, determined at the half maximum between peak and trough vs. no LP controls. A two-way ANOVA (time, wavelength) was used to determine significant variation between samples. Amplitude and baseline were detrended using BioDare2 (Zielinski et al., 2014), and a Tukey post-test was used to determine significance in phase shift relative to DD control. p < 0.01 and ∗∗p < 0.001 (n = 8).

Acknowledgments
This image is the copyrighted work of the attributed author or publisher, and ZFIN has permission only to display this image to its users. Additional permissions should be obtained from the applicable author or publisher of the image. Full text @ Front. Physiol.