
- Title
-
The multifaceted role of protein kinase CK2 in high-risk acute lymphoblastic leukemia
- Authors
- Zhou, Y., Lian, H., Shen, N., Korm, S., Lam, A.K.P., Layton, O., Huiting, L.N., Li, D., Miao, K., Zeng, A., Landesman-Bollag, E., Seldin, D.C., Fu, H., Hong, L., Feng, H.
- Source
- Full text @ Haematologica
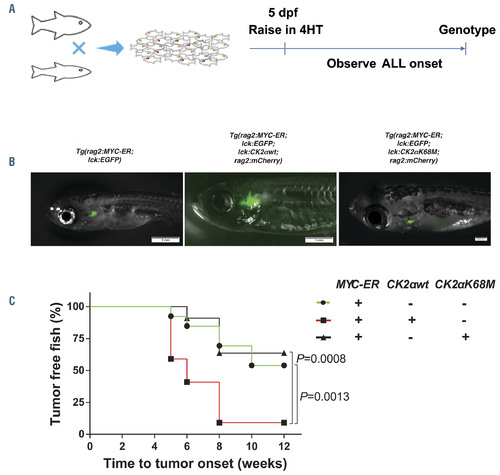
Overexpression of wild-type but not enzyme dead CK2α promotes the onset of MYC-induced acute lymphoblastic leukemia in zebrafish. (A) Diagram of the experimental design. (B) Thymic fluorescence in the Tg(rag2:MYC-ER;lck:EGFP) (left), Tg(rag2:MYC-ER;lck:EGFP;lck:CK2αwt; rag2:mCherry) (middle), and Tg(rag2:MYC-ER;lck:EGFP;lck:CK2αK68M;rag2:mCherry) (right) fish raised in 129 nM 4-hydroxytamoxifen (4HT) at 12 weeks of life. One representative fish is shown for each group. (C) Kaplan-Meier analysis of tumor-free fish revealed that overexpression of CK2αwt but not CK2αK68M significantly accelerated the onset of MYC-induced acute lymphoblastic leukemia (ALL) (P=0.0013 for Tg(rag2:MYC-ER;lck:EGFP) [MYC-ER; green line] vs. Tg(rag2:MYCER; lck:EGFP;lck:CK2αwt; rag2:mCherry); [MYC-ER;CK2αwt; red line] n=19 and n=22, respectively; and P=0.0008 for MYC-ER;CK2αwt [red line] vs.Tg(rag2:MYCER; lck:EGFP;lck:CK2αK68M;rag2:mCherry) [MYC-ER;CK2αK68M; black line], n=22 and n=13, respectively). There was no statistical significance between MYCER and MYC-ER;CK2αK68M fish. Statistical analysis was performed using the log-rank test. The scale bar in the left and middle panel of Figure 1B =1 mm and in the right panel =200 mm. PHENOTYPE:
|
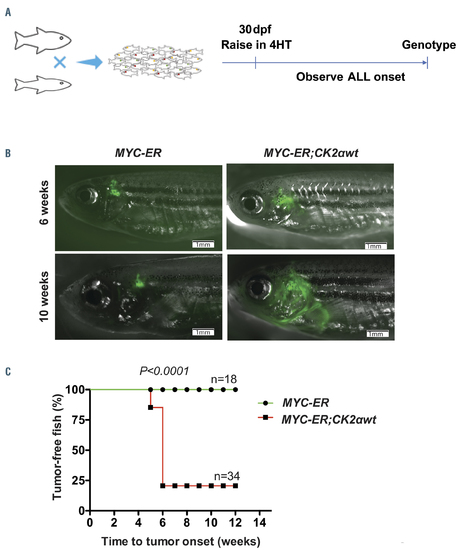
CK2α overexpression overcomes temporal restriction of MYC-induced lymphocyte transformation and induces leukemia at the later stage of development. (A) Diagram of the experimental design. (B) Thymic fluorescence in MYC-ER and MYC-ER;CK2αwt zebrafish that were raised in 129 nM 4-hydroxytamoxifen (4HT) beginning at 30 dpf. (C) Kaplan-Meier analysis of tumor-free fish based on genotype (P<0.0001; n=18 for MYC-ER and n=34 for MYC-ER;CK2αwt fish). Statistical analysis was performed using the log-rank test and scale bars =1 mm. PHENOTYPE:
|
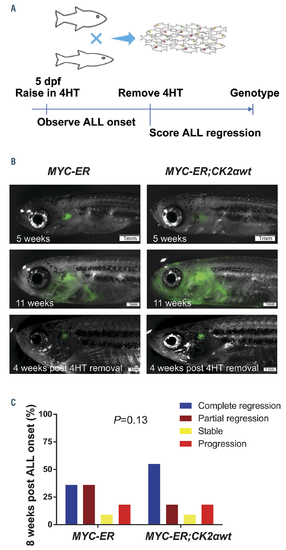
CK2α overexpression alone cannot maintain acute lymphoblastic leukemia in the absence of aberrant MYC activation. (A) Diagram of the experimental design. (B, top panel) Thymic fluorescence in MYC-ER (left) and MYC-ER;CK2αwt (right) zebrafish raised in 129 nM 4-hydroxytamoxifen (4HT) for 5 weeks showing tumor initiation in MYC-ER;CK2αwt fish. (B, middle panel) shows both MYC-ER (left) and MYC-ER;CK2αwt (right) with aggressive disease at 11 weeks although MYCER; CK2αwt fish developed more aggressive ALL than MYC-ER fish. (B, bottom panel) shows thymic fluorescence 4 weeks after 4HT withdrawal. One representative fish is shown for each group. (C) Zebrafish were classified by the indicated tumor phenotype at 8 weeks post 4HT removal (P=0.13; MYC-ER vs. MYCER; CK2αwt; n=11 per group). The difference in observed tumor phenotypes between each group as a whole was statistically insignificant, as calculated by a two-way ANOVA test. Scale bars =1 mm. ALL: acute lymphoblastic leukemia. |