
- Title
-
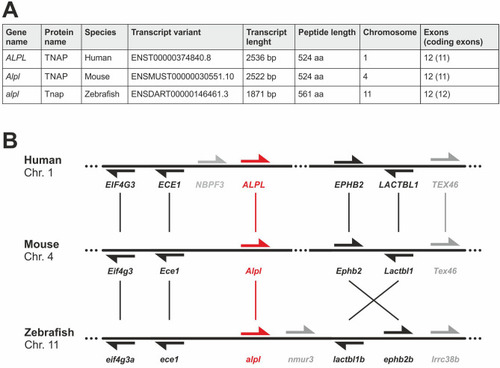
Investigation of alpl expression and Tnap-activity in zebrafish implies conserved functions during skeletal and neuronal development
- Authors
- Ohlebusch, B., Borst, A., Frankenbach, T., Klopocki, E., Jakob, F., Liedtke, D., Graser, S.
- Source
- Full text @ Sci. Rep.
( |
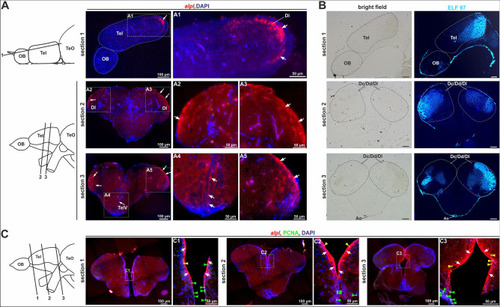
EXPRESSION / LABELING:
|
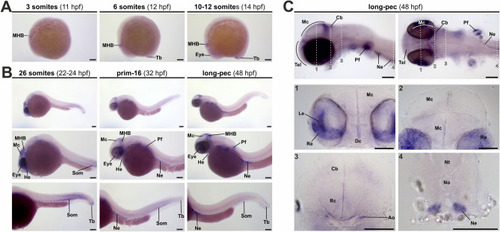
Expression pattern of EXPRESSION / LABELING:
|
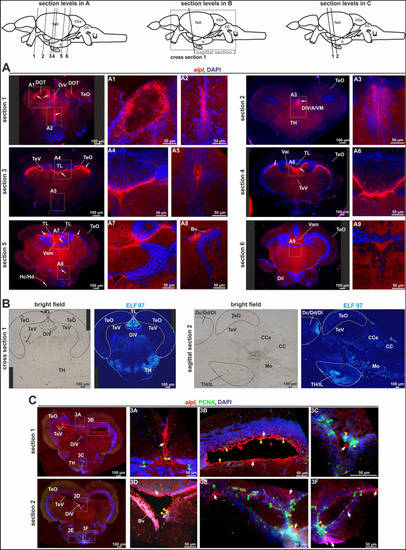
EXPRESSION / LABELING:
|
EXPRESSION / LABELING:
|
EXPRESSION / LABELING:
|
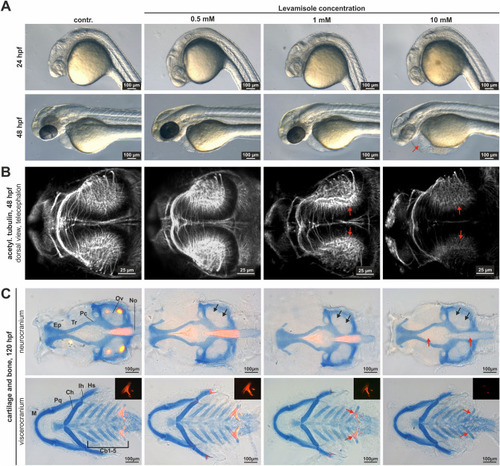
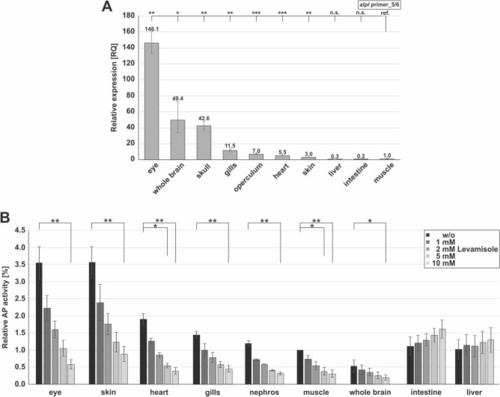
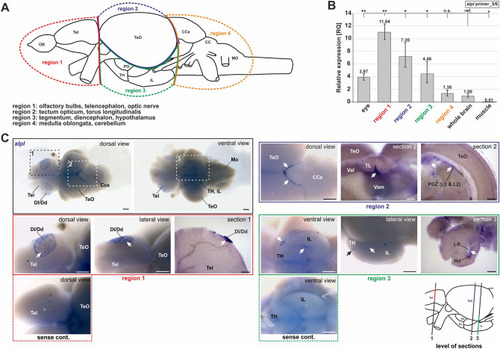
Inhibition of Tnap-activity leads to alterations in axon and mineralization. ( |

ZFIN is incorporating published figure images and captions as part of an ongoing project. Figures from some publications have not yet been curated, or are not available for display because of copyright restrictions. |
|
ZFIN is incorporating published figure images and captions as part of an ongoing project. Figures from some publications have not yet been curated, or are not available for display because of copyright restrictions. PHENOTYPE:
|