
- Title
-
Fast, In Vivo Model for Drug-Response Prediction in Patients with B-Cell Precursor Acute Lymphoblastic Leukemia
- Authors
- Gauert, A., Olk, N., Pimentel-Gutiérrez, H., Astrahantseff, K., Jensen, L.D., Cao, Y., Eggert, A., Eckert, C., Hagemann, A.I.H.
- Source
- Full text @ Cancers
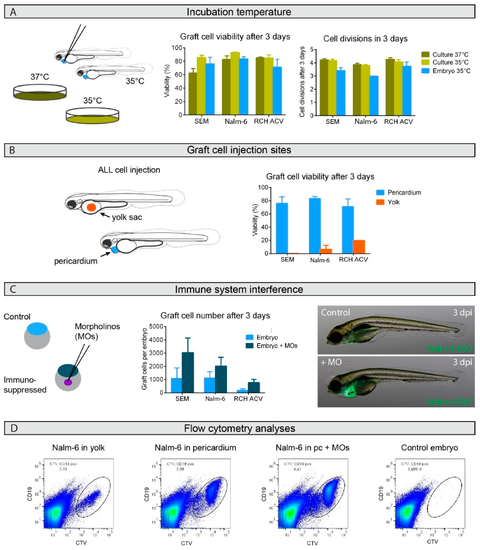
Successful B-cell precursor acute lymphoblastic leukemia (BCP-ALL) graft expansion in zebrafish embryos depends on graft site and host immunosuppression but not on temperature. (A). Viability and growth rate were flow cytometrically assessed for graft cells from groups of 10–20 zebrafish embryos at 35 °C or classical in vitro cultures at 35 °C and 37 °C from three or four independent experiments. (B). Graft cell viability was flow cytometrically assessed 3 days after injection into either the yolk sac (orange) or pericardium (blue). The two independent experiments performed for injections of Nalm-6 into the yolk sac compared to the four experiments with pericardium injections produced a significant difference, with a p-value of 0.007 in an unpaired t-test. Injections were performed in groups of 10–20 embryos. (C). Host embryos were immunosuppressed by morpholino (MO) injection into fertilized eggs (dark blue) and compared to untreated controls (light blue). Graft cell number per host embryo was calculated from flow cytometric analyses from groups of 10–20 embryos in three or four independent experiments. The comparisons of immunosuppressed injections with untreated controls produced p-values in a paired t-test: p = 0.045 for SEM cells, p = 0.095 for Nalm-6 cells and p = 0.049 for RCH-ACV cells. Bars represent means ± SEM. Microscopic images show 5-day old host embryos with (+MO) or without (control) immunosuppression 3 days post-injection (dpi) with DiO-labeled Nalm-6 cell injections into the pericardium. Only one biological replicate was performed for SEM and RCH-ACV injections into the yolk sac. Representative images shown. (D). Representative flowcytometric scatter plots of Nalm-6 cells following engraftment in zebrafish embryos. CD19 positive Nalm-6 cells prelabeled with CellTrace Violet can be separated from auto-fluorescent zebrafish cells to sort out the graft cell population for analysis. Engraftment site indicated as well as whether the host embryo was transiently immunosuppressed using morpholinos (MOs). Groups of 10 embryos from each treatment group were pooled before single-cell dissociation for flow cytometric analysis. Control embryos not engrafted show auto-fluorescence. For details see also Figure S1. Pc = pericardium. |
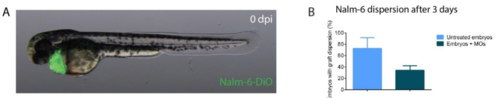
Intact host immune system promotes graft cell dissemination. A. Two-day old zebrafish embryo with green fluorescent DiO-labeled Nalm-6 graft in the pericardium shortly after injection. B. Mean percentage of embryos with DiO-labeled Nalm-6 graft cell dissemination at 3 days post- injection (dpi) with or without immunosuppression prior to injection counted from 3 independent experiments with 30 embryos each as depicted in Figure 1C. Error bars represent SEM, p-value = 0.074 in a paired t-test. |
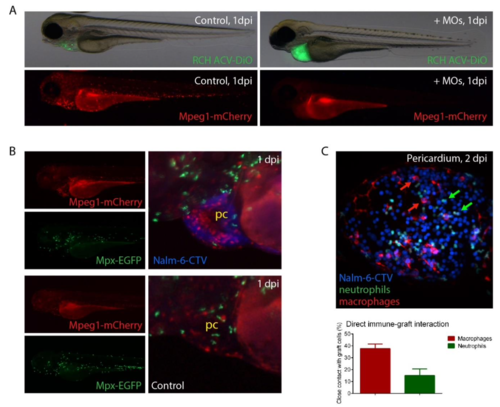
Host macrophages and neutrophils interact differently with ALL xenografts at the injection site. A. Morpholinos (MOs) against spi1/csf3r were injected into fertilized eggs of the tg(mpeg1- mCherry) reporter zebrafish line (red signal) to suppress macrophage development. Both embryos were transplanted with DiO labelled RCH-ACV cells (green signal) at 2 days post-fertilization. Green signal shows graft expansion at 3 days post-fertilization in the immunosuppressed fish (right) compared to the uninjected control (left). Single red cells are macrophages present in the control (left) but absent in the immunosuppressed embryo (right). B. Fluorescent images of double transgenic, live embryos with fluorescent macrophages (red, mpeg1-mCherry) and neutrophils (green, mpx-EGFP) represented as single channels or merge with engrafted CTV-labeled Nalm-6 cells (blue) into the pericardium (pc) or control without graft. Caudal is to the right and ventral to the bottom, all zebrafish embryos shown are not transiently immunosuppressed. C. Merged fluorescent high-resolution image of pericardium (ventral view) of a double-transgenic, live embryo as shown in B, engrafted with CTV- labeled Nalm-6 cells 2dpi. Arrows indicate macrophages (red) and neutrophils (green) in close contact with graft cells (blue). Bars indicate mean (n = 8) percentage of macrophages and neutrophils present at the graft site that interact closely with Nalm-6 cells at 2dpi. Error bars represent SEM. PHENOTYPE:
|