
FIGURE SUMMARY
- Title
-
Feeding and food availability modulate brain-derived neurotrophic factor, an orexigen with metabolic roles in zebrafish
- Authors
- Blanco, A.M., Bertucci, J.I., Hatef, A., Unniappan, S.
- Source
- Full text @ Sci. Rep.
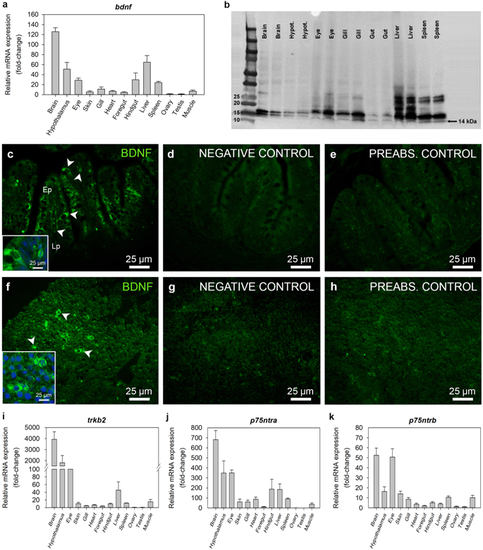
Distribution of BDNF and its receptors in the zebrafish. (a) Tissue distribution of bdnf mRNAs in zebrafish. Quantitative analysis of mRNA expression was performed by RT-qPCR considering β-actin as reference gene. Data are expressed as mean + SEM (n = 6), relative to the tissue with the lowest mRNA expression. (b) Full-length Western blot image showing BDNF protein in zebrafish tissues (n = 2). Protein molecular weight (in kDa) is shown in figure. (c–h) Representative sections of zebrafish gut (c–e) and liver (f–h) showing BDNF immunofluorescence (green). A magnified image of representative cells immunopositive for BDNF is shown in a square inset for both foregut and liver. In insets, nuclei are stained blue (DAPI). No or small immunoreactivity was detected in negative (d,g) or preabsorption (e,h) controls. Scale bars are indicated in each image. (i–k) Tissue distribution of mRNAs encoding BDNF receptors in zebrafish. Data obtained by RT-qPCR are expressed as mean + SEM (n = 6), relative to the tissue with the lowest mRNA expression. Ac absorptive cell, BDNF brain-derived neurotrophic factor, Ep epithelium, Lp lamina propria, p75ntr neurotrophin receptor p75, trkb tropomyosin receptor kinase B. |
Acknowledgments
This image is the copyrighted work of the attributed author or publisher, and
ZFIN has permission only to display this image to its users.
Additional permissions should be obtained from the applicable author or publisher of the image.
Full text @ Sci. Rep.