FIGURE SUMMARY
Title

Tfam Knockdown Results in Reduction of mtDNA Copy Number, OXPHOS Deficiency and Abnormalities in Zebrafish Embryos

Authors
Otten, A.B.C., Kamps, R., Lindsey, P., Gerards, M., Pendeville-Samain, H., Muller, M., van Tienen, F.H.J., Smeets, H.J.M.
Source
Full text @ Front Cell Dev Biol

Knockdown of TFAM in zebrafish embryos. Zebrafish embryos injected with indicated amount of either Control-morpholino (Ctrl-MO) or tfam splice-morpholino tfam splice-MO at 1 hpf and analyzed at 4 dpf. (A)tfam splice-morpholino (MO) at the 3′ splice site of exon 2 causes deletion of exon 2, which predicts a frame-shift and premature stop codon (p.(Cys29Hisfs*36)) (figure is not on scale). (B) The relative copy number assessed by mitochondrial ND1/nuclear B2M ratio. Data are normalized to the NIC embryos (n = 7). Bars indicate mean values with SD, n = 20 per 2 ng injected condition and n = 16 per 4 ng injected condition. P-values are calculated using ANOVA followed by Bonferroni’s Multiple Comparison Test to assess copy number, *P-value < 0.05, **P-value < 0.01. (C) The oxygen consumption rate (OCR) measured by Seahorse XF24 in order to assess basal respiration and maximal ATP production capacity at 4 dpf using 2 ng MO. The statistical analysis was performed by using a student t-test (P < 0.05), n = 10 per tfam splice-MO condition and n = 9 per Ctrl-MO condition.

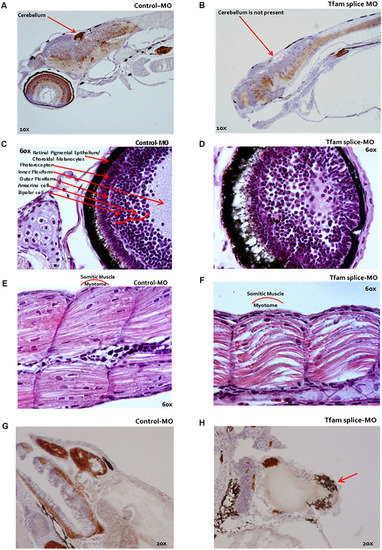
Microscopy of zebrafish embryos following TFAM knockdown. (A–H) Microscopic analysis following serial HE-staining of zebrafish embryos at 4 dpf, which were injected at 1 hpf with either 2 ng tfam splice-MO (B–E) or 2 ng Ctrl-MO, (A,C,E,G)n = 13 each condition. (B) The cerebellum was missing in the phenotype or a delayed development of this cerebellum in these fish. (D) The eyes were smaller and the eye layers were less developed. (F) A muscle phenotype was clearly visible in the dorsal fin, especially in the myotomic area, which was less compact in these somatic muscles. (H) The fish displayed a marked pericardial oedema (red arrow). They did not develop a normally looped heart as in Ctrl-MO (G), but the hearts were dilated in the phenotypes (H).

Schematic overview of alterations in tfam splice-MO zebrafish at 4dpf. The arrow indicates if a process is upregulated (green) or down-regulated (red). Altered gene expression processes and genes are shown in italic. The mitochondrial DNA figure is adapted from Amorim et al. (2019).

Acknowledgments
This image is the copyrighted work of the attributed author or publisher, and ZFIN has permission only to display this image to its users. Additional permissions should be obtained from the applicable author or publisher of the image. Full text @ Front Cell Dev Biol