FIGURE SUMMARY
Title

Chronic unpredictable stress induces anxiety-like behaviors in young zebrafish

Authors
Golla, A., Østby, H., Kermen, F.
Source
Full text @ Sci. Rep.

CUS exposure does not affect anxiety-like behaviors two days post-CUS in the open field test. (A) Representative swimming trajectory of a fish (in red) during the open field test lasting for ten minutes. The outer circle is indicated by two concentric black circles. (B) Thigmotaxis index that corresponds to the percentage of time spent in the outer circle. (C) Average swimming velocity in body length/second. The dot signaled by a red square was out of range (value = 2.78). (D) Total distance travelled for ten minutes in body length. The dot signaled by a red square was out of range (value = 1669). Each dot represents one fish (control: n = 99 fish; stressed: n = 94 fish). Data are represented as mean ± SEM.

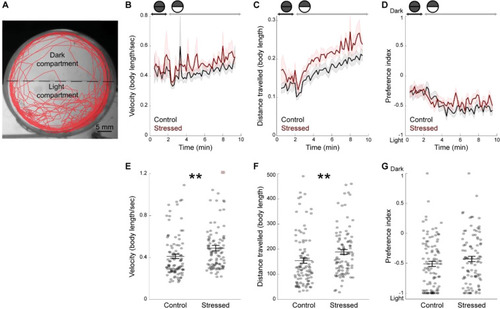
No change in light preference, but increased light-induced locomotion two days post-CUS, in CUS-exposed fish. (A) Representative swimming trajectory (in red) of a 19 dpf fish during the dark-light test. Fish were initially maintained in the dark for two minutes (dark phase). Upon the start of illumination (light phase), they had the choice between a dark and a light compartment for eight minutes. (B) Average velocity during the dark and light phases, per time bins of twelve seconds, in body length/second. (C) Average distance travelled during the dark and light phases, per time bins of twelve seconds, in body length. (D) Preference index over time, during the dark and light phases, calculated per time bins of twelve seconds. (E) Average velocity of the fish during the light phase. The dot signaled by a red square was out of range (value = 2.07). (F) Total distance travelled by the fish during the light phase. (G) Preference index for the dark or the light compartments during the light phase. Values of −1 indicate 100% time spent in the light compartment and values of 1 indicate 100% time spent in the dark compartment. Each dot represents one fish (control: n = 99 fish; stressed: n = 94 fish). Data are represented as mean ± SEM. **p < 0.01, Kruskal-Wallis test.

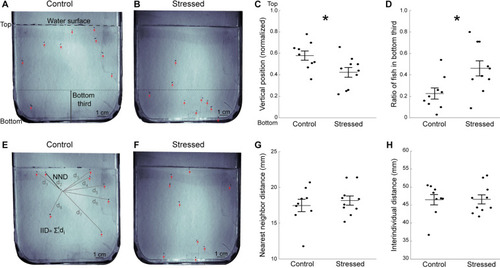
Decreased exploration of the novel tank in stressed fish tested one day post-CUS. (A) Representative image showing control fish’s position in the arena at the beginning of the novel tank test. The arena is vertically positioned and the dashed line at the top indicates the water surface. The red arrows indicate the fish, and the the bottom third of the tank is indicated. (B) Representative image showing stressed fish’s position at the beginning of the novel tank test. (C) Average vertical position of all fish during the early phase of the novel tank test (see Methods). (D) Ratio of fish in the bottom third of the tank. (E) Representative image showing control fish’s position relative to each other in the late phase (from three to ten minutes) of the novel tank test, in the same group as in A. The black line indicates the distance from a fish to its nearest neighbor (NND). The grey lines indicate the distance between one fish to the other fish in the tank that are used for interindividual distance (IID) calculations. (F) Representative image showing stressed fish’s position in the late phase of the novel tank test, in the same group as in (B). (G) Average nearest neighbor distance for all fish in the arena from three to ten minutes. (H) Average interindividual distance for all fish in the arena from three to ten minutes. Each dot represents the average value for one group of fish (control: n = 9 groups; stressed: n = 10 groups). Data are represented as mean ± SEM. *p < 0.05, Student’s t-test.

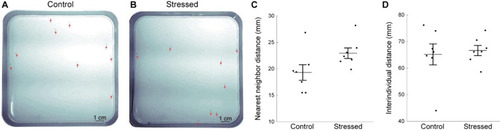
CUS exposure does not affect shoaling. Shoaling was measured for twenty minutes in a horizontal arena. (A) Representative image of the position of control fish relative to each other. (B) Representative image of the position of stressed fish relative to each other. Red arrows indicate the fish’s positions. (C) Average nearest neighbor distance for all fish in the arena. (D) Average interindividual distance for all fish in the arena. Each dot represents the average value for a group of fish (control: n = 7 groups; stressed: n = 7 groups). Data are represented as mean ± SEM.

Acknowledgments
This image is the copyrighted work of the attributed author or publisher, and ZFIN has permission only to display this image to its users. Additional permissions should be obtained from the applicable author or publisher of the image. Full text @ Sci. Rep.