
- Title
-
miR-430a regulates the development of left-right asymmetry by targeting sqt in the teleost
- Authors
- Yang, F., Qi, J.
- Source
- Full text @ Gene
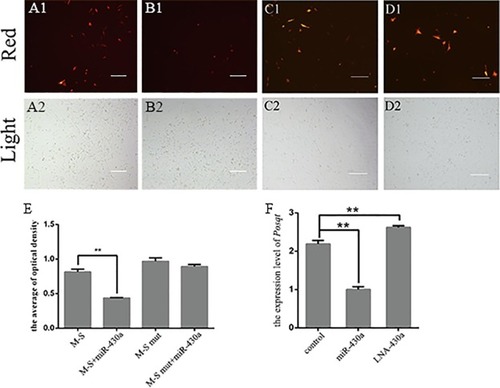
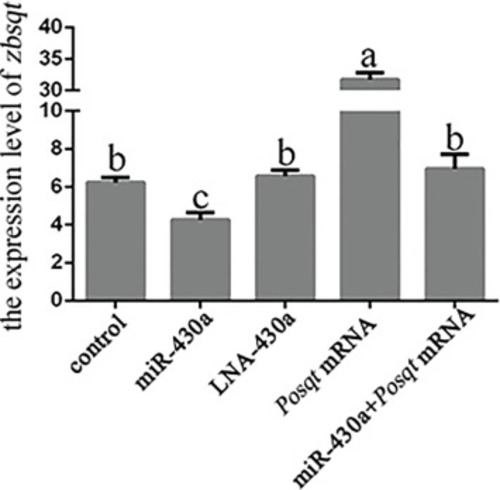
Posqt is the target of miR-430a. (A-D) Transfected embryonic cells of Japanese flounder at 48 h after transfection. (A1-A2) Transfected vector only. (B1-B2) Plasmid was transfected with miR-430a mimic, and (C1-C2) Transfected mutational vector only. (D1-D2) Mutational vector was transfected with miR-430a mimic. The average of optical density was counted by ImageJ (E). Injected embryos of Japanese flounder showed the expression of Posqt (F). The scale bar of A1-D2 is 100 μm. Data are shown as mean ± SD (n = 3). Asterisks indicate significant difference (P < 0.01). |
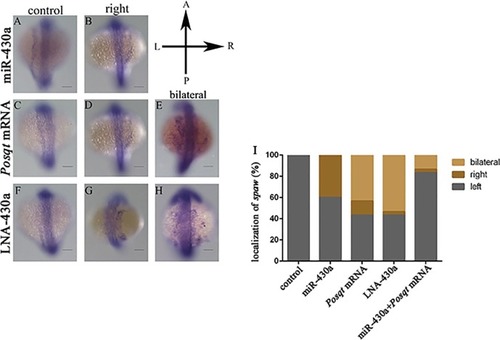
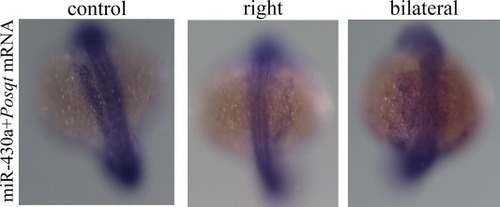
Disrupted left-right patterning was rescued by Posqt. A-H: the localization of spaw in wild-type and the group of injecting with miR-430a, LNA-430a, sqt mRNA (Japanese flounder) and miR-430a and sqt mRNA (Japanese flounder) co-injection at 18 somite stage; I: percentages of left, right and bilateral localization of spaw in wild-type and the group of injecting with miR-430a, LNA-430a, sqt mRNA (Japanese flounder) and miR-430a and sqt mRNA (Japanese flounder) co-injection. Views are dorsal. |
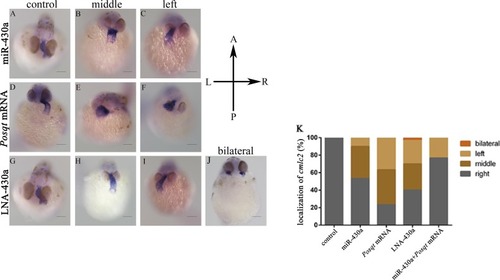
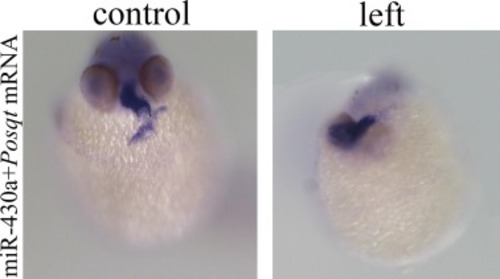
Disrupted left-right patterning of heart was rescued by Posqt. A-J: the localization of cmlc2 in wild-type and the group of injecting with miR-430a, LNA-430a, sqt mRNA (Japanese flounder) and miR-430a and sqt mRNA (Japanese flounder) co-injection at 36 hpf; K: percentages of left, right and bilateral localization of cmlc2 was counted. Views are ventral. |
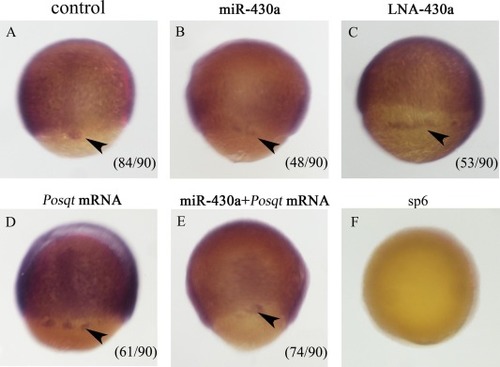
Disrupted the development of DFC was rescued by Posqt. A-E (antisense): localization of sox17 in wild-type and the group of injected with miR-430a, LNA-430a, Posqt mRNA (Japanese flounder) and miR-430a and Posqt mRNA (Japanese flounder) co-injection at 8 hpf; F: sense. The black arrowheads indicate the location of DFC. |
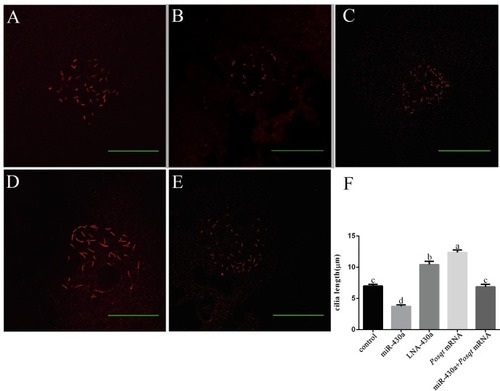
Disrupted the development of cilia in the Kupffer’s vesicle (KV) was rescued by Posqt. A-E: cilia was marked by immunohistochemistry with antibodies against acetylated tubulin (red) in wild-type and the group of injecting with miR-430a, LNA-430a, Posqt mRNA and miR-430a and Posqt mRNA co-injection respectively, at 70% epiboly. The scale bar of A-E is 100 μm. F: the length of cilia was measured by ImageJ. Values with different superscripts indicate statistical significance (P < 0.05). (For interpretation of the references to colour in this figure legend, the reader is referred to the web version of this article.) |
Supplementary figure 1. |
Supplementary figure 2. |
Supplementary figure 3. |
Supplementary figure 4. |
Supplementary figure 5. |
Supplementary figure 6. |
Reprinted from Gene, 745, Yang, F., Qi, J., miR-430a regulates the development of left-right asymmetry by targeting sqt in the teleost, 144628, Copyright (2020) with permission from Elsevier. Full text @ Gene