FIGURE SUMMARY
Title

Effect of Ataluren on dystrophin mutations

Authors
Berger, J., Li, M., Berger, S., Meilak, M., Rientjes, J., Currie, P.D.
Source
Full text @ J. Cell. Mol. Med.

ZFIN is incorporating published figure images and captions as part of an ongoing project. Figures from some publications have not yet been curated, or are not available for display because of copyright restrictions.

ZFIN is incorporating published figure images and captions as part of an ongoing project. Figures from some publications have not yet been curated, or are not available for display because of copyright restrictions.

ZFIN is incorporating published figure images and captions as part of an ongoing project. Figures from some publications have not yet been curated, or are not available for display because of copyright restrictions.

ZFIN is incorporating published figure images and captions as part of an ongoing project. Figures from some publications have not yet been curated, or are not available for display because of copyright restrictions.

ZFIN is incorporating published figure images and captions as part of an ongoing project. Figures from some publications have not yet been curated, or are not available for display because of copyright restrictions.

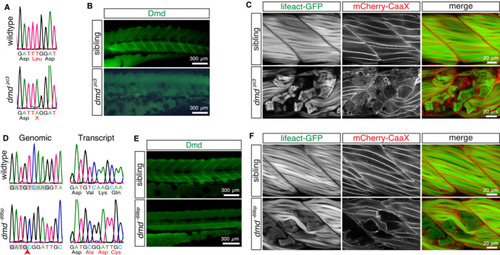
Novel dystrophin‐deficient mutants. A, A > T substitution within exon 34 of dmdpc3 results in a nonsense mutation. B, Whole‐mount immunohistochemistry with antibodies against dystrophin revealed loss of dystrophin protein in 3‐dpf‐old dmdpc3 homozygotes. C, At 3 dpf, labelling of the sarcolemma with mCherryCaaX and the myofibril with Lifeact‐GFP confirmed myofibre detachment within dmdpc3 homozygotes. D, 5 bp from exon 53 and 64 bp from the downstream intron was removed from the dystrophin gene in dmd−69bp mutants. Altered splicing in dmd−69bp led to integration of 10 bp from the intron downstream of exon 53 into the dystrophin transcript, resulting in a frameshift and multiple subsequent PTCs. E, Dystrophin protein is lost in dmd−69bp homozygotes, as indicated by antibodies against dystrophin at 3 dpf. F, Retracting myofibres within 3‐dpf‐old dmd−69bp were revealed in the double transgenic background of Tg(acta1:mCherryCaaX) and Tg(acta1:lifeact‐GFP)

EXPRESSION / LABELING:
Gene:
Fish:
Anatomical Term:
Stage: Protruding-mouth
PHENOTYPE:
Fish:
Observed In:
Stage: Protruding-mouth

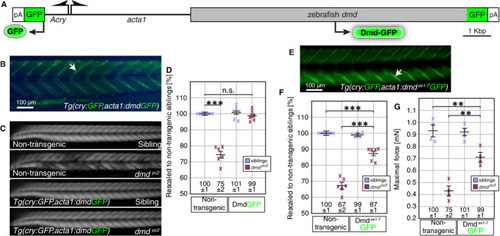
The dystrophin isoform Dmd∆ex1‐7 lacking exons 1‐7 is partially functional. A, Schematic of the construct used to generate the transgenic line Tg(αAcry:GFP,acta1:dmdGFP). The acta1 promoter directed full‐length dystrophin into muscle and the αA‐crystallin promoter (αAcry) drove GFP expression into the lens for rapid identification of transgenic animals. pA indicates SV40 polyA signal. B, In 3‐dpf‐old Tg(cry:GFP,acta1:dmdGFP) larvae, fluorescence of the Dmd‐GFP fusion protein was detected at the vertical myosepta (arrowheads). C, Polarized light visualized the muscle of 3‐dpf‐old larvae. Whereas the birefringence of non‐transgenic siblings appeared uniform, the birefringence of dmdpc2 homozygotes appeared patchy. In contrast, in the transgenic background of Tg(cry:GFP,acta1:dmdGFP) the birefringence of dmdpc2 homozygotes and siblings was comparable. D, Quantification of the birefringence followed by rescaling to non‐transgenic siblings revealed that the birefringence of dmdpc2 homozygotes transgenic for Tg(cry:GFP,acta1:dmdGFP) was not significantly changed compared with non‐transgenic dmdpc2 siblings. Crosses represent averaged grey values of at least five 72‐hpf‐old larvae. Black bars represent mean ± SEM and n.s. non‐significant. Significance was determined by one‐way ANOVA with Tukey's multiple comparisons post hoc test (***P < 0.001, n = 6). E, Within Tg(cry:GFP,acta1:dmd∆ex1‐7GFP) larvae, N‐terminally truncated dystrophin fused to GFP localized to the vertical myosepta as indicated by the GFP fluorescence. F, After rescaling to non‐transgenic siblings, the birefringence of dmdpc2 homozygotes transgenic for Tg(cry:GFP,acta1:dmd∆ex1‐7GFP) was significantly ameliorated compared with non‐transgenic dmdpc2 homozygotes, but significantly reduced compared with non‐transgenic dmdpc2 siblings. Crosses represent averaged grey values of at least five 72‐hpf‐old larvae. Black bars are mean ± SEM Significance was determined by one‐way ANOVA with Tukey's multiple comparisons post hoc test (***P < 0.001, n = 6). G, At 6 dpf, the maximal force generated by dmdpc2 homozygotes positive for Tg(cry:GFP,acta1:dmd∆ex1‐7GFP) was significantly stronger compared with non‐transgenic dmdpc2 homozygotes, but significantly reduced compared with non‐transgenic dmdpc2 siblings. Crosses represent individual larvae and black bars mean ± SEM. Significance was determined by one‐way ANOVA with Tukey's multiple comparisons post hoc test (**P < 0.01, n = 4)

Acknowledgments
This image is the copyrighted work of the attributed author or publisher, and ZFIN has permission only to display this image to its users. Additional permissions should be obtained from the applicable author or publisher of the image. Full text @ J. Cell. Mol. Med.