
- Title
-
New insights into the early mechanisms of epileptogenesis in a zebrafish model of Dravet syndrome
- Authors
- Tiraboschi, E., Martina, S., van der Ent, W., Grzyb, K., Gawel, K., Cordero-Maldonado, M.L., Poovathingal, S.K., Heintz, S., Satheesh, S.V., Brattespe, J., Xu, J., Suster, M., Skupin, A., Esguerra, C.V.
- Source
- Full text @ Epilepsia
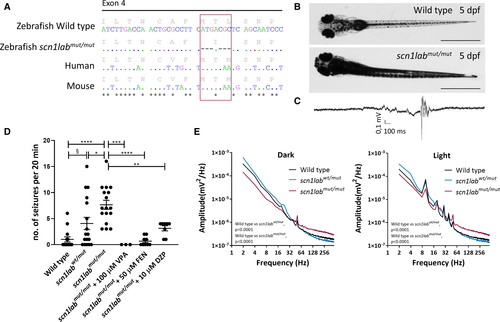
Development of scn1labmut/mut zebrafish model by CRISPR/Cas9 technique and its characterization. A, Amino acid and nucleotide sequence of scn1lab in zebrafish wild type (WT) and scn1labmut/mut, and orthologues in human ( SCN1A) and mouse ( Scn1a). Dots indicate identical nucleotides, dashes indicate deletions, and stars indicate identical nucleotides in all four sequences. B, WT and scn1labmut/mut larvae at 5 days postfertilization (dpf). Increased pigmentation is observed in mutants. Scale bars = 1 mm. C, Example of local field potential (LFP) recording obtained from the scn1labmut/mut tectum at 5 dpf, showing a seizure event with preictal and ictal phase. D, scn1labmut/mut larvae at 5 dpf show an increased number of seizures over a 20‐minute period compared to WT larvae or scn1labwt/mut siblings. A low number of seizures were observed in WT larvae, likely caused by needle insertion into the optic tectum. scn1labwt/mut displayed a larger number of seizures on average than WT larvae, but more interindividual variability was observed, with some larvae displaying no seizures, whereas others were affected to the same extent as homozygous larvae. No significant difference in the number of seizures was observed between WT larvae and scn1labmut/mutlarvae treated with valproic acid (VPA), fenfluramine (FEN), or diazepam (DZP), indicating efficacy of these drugs in reducing the number of seizures to background levels. Significance was calculated using one‐way analysis of variance with Tukey post hoc test (* P < .05, ** P < .01, *** P < .001, **** P < .0001) or unpaired, two‐tailed t test (§ P < .05). E, Power spectrum analyses of LFP recordings performed under dark conditions, or under a 10‐Hz flashing light stimulus. The energy profile of scn1labmut/mut larvae differs significantly from WT and scn1labwt/mut siblings in both conditions. A Kolmogorov‐Smirnov test was used to calculate significance PHENOTYPE:
|

ZFIN is incorporating published figure images and captions as part of an ongoing project. Figures from some publications have not yet been curated, or are not available for display because of copyright restrictions. PHENOTYPE:
|
|
ZFIN is incorporating published figure images and captions as part of an ongoing project. Figures from some publications have not yet been curated, or are not available for display because of copyright restrictions. |
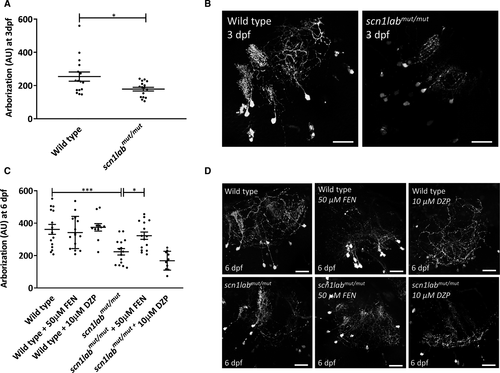
Dendritic arborization in scn1labmut/mut larvae. A, scn1labmut/mut larvae show a reduced number of dendritic arbors at 3 days postfertilization (dpf). Significance of differences was calculated using an unpaired, two‐tailed t test. * P < .05. B, Representative images of dendritic arbors in the neuropil of wild‐type (WT) and scn1labmut/mut larvae at 3 dpf. Scale bars = 25 μm. C, Reduction in dendritic arborization in scn1labmut/mut larvae observed at 6 dpf can be rescued by the addition of 50 μmol/L of fenfluramine (FEN), but not 10 μmol/L of diazepam (DZP), from 3 dpf until 6 dpf. Significance of differences was calculated using one‐way analysis of variance with Sidak post hoc test. * P < .05, *** P < .001. D, Representative images of dendritic arbors in the neuropil of WT and scn1labmut/mut larvae at 6 dpf, with or without prior incubation in 50 μmol/L of FEN or 10 μM of DZP from 3 dpf onward. Scale bars = 25 μm PHENOTYPE:
|
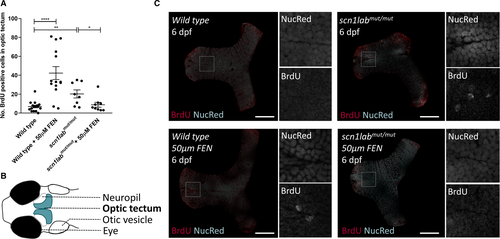
Proliferation of cells in the optic tectum of scn1labmut/mut larvae. A, At 6 days postfertilization (dpf), scn1labmut/mut larvae showed an increased number of proliferating cells in the optic tectum, as measured by BrdU‐positive cells in 30‐μm‐thick optical sections. Incubation of larvae in 50 μmol/L of fenfluramine (FEN) from 3 dpf onward resulted in an increased number of BrdU‐positive cells in wild‐type (WT) larvae at 6 dpf, while reducing the number to untreated WT levels in the scn1labmut/mut larvae. Statistical significance was calculated using multiple unpaired, two‐tailed t tests. * P < .05, ** P < .01, **** P < .0001. B, Cartoon representation of the head of a 6‐dpf larva, indicating the position of the optic tectum where proliferation was measured. C, Representative z‐slices of masked optic tecta with BrdU staining of WT and scn1labmut/mut larvae at 6 dpf, with or without prior incubation in 50 μmol/L of FEN from 3 dpf onward. Squares indicate the location of the zoomed‐in, split‐channel images to the right. Scale bars = 50 μm PHENOTYPE:
|
|
ZFIN is incorporating published figure images and captions as part of an ongoing project. Figures from some publications have not yet been curated, or are not available for display because of copyright restrictions. PHENOTYPE:
|