
- Title
-
Zebrafish Embryos Allow Prediction of Nanoparticle Circulation Times in Mice and Facilitate Quantification of Nanoparticle-Cell Interactions
- Authors
- Dal, N.K., Kocere, A., Wohlmann, J., Van Herck, S., Bauer, T.A., Resseguier, J., Bagherifam, S., Hyldmo, H., Barz, M., De Geest, B.G., Fenaroli, F.
- Source
- Full text @ Small
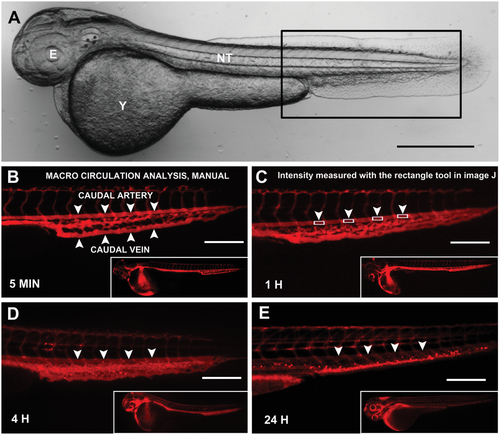
Circulation of NPs in the zebrafish embryo, manual analysis. A) Acquisition of the zebrafish embryo at 48 h post fertilization in the transmission channel; the rectangular inset shows the area where the caudal region images were taken. B–E) Images of the caudal vein of zebrafish injected with fluorescent NPs (here 100 nm liposomes with PEG) imaged at different time points—B) 5 min, C)1 h, D) 4 h, and E) 24 h. B) The main blood components of the caudal region are shown by arrowheads (caudal artery and caudal vein). C) The rectangles used for quantification of fluorescence are shown (arrowheads); these are either manually or automatically placed on the caudal artery and in between intersegmental vessels. D,E) The decrease in fluorescence of the caudal artery (arrowheads) can be seen at 4 and 24 h. B–E, insets) The values for fluorescence in the artery are normalized relative to the overall NP fluorescence in the whole fish. Scale bars: A) 500 nm and B–E) 200 nm. |
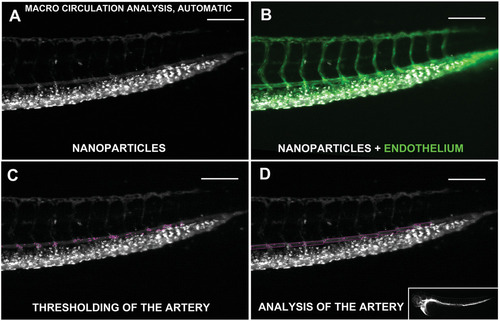
Circulation of NPs in the zebrafish embryo, automatic analysis. This image shows the steps performed by the MACRO for the analysis of the fluorescence in the caudal artery. A) The image processing of zebrafish injected with fluorescent NPs (99 nm PEGylated liposomes with biotin) utilizes B) the fluorescent signal of the vasculature to identify the caudal artery. C) Fluorescence due to NP uptake in the artery is removed, and D) regions in between intersegmental vessels are automatically detected to calculate the relative fluorescence. The results are then normalized relative to the fluorescence of the whole fish (panel (D), lower right image). |
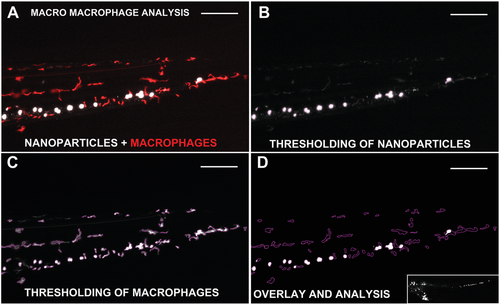
Macrophage uptake of NPs. Illustration of the steps undertaken by the MACRO for macrophage analysis to calculate the uptake of NPs. A) Zebrafish embryos injected with 623 nm liposomes without PEG (white) and fluorescent macrophages (red) are used for the analysis. B,C) NPs and macrophages are first thresholded, and D) their signals subsequently overlapped for analysis. The obtained values are normalized by the fluorescence of the whole zebrafish (panel (D), lower image). |
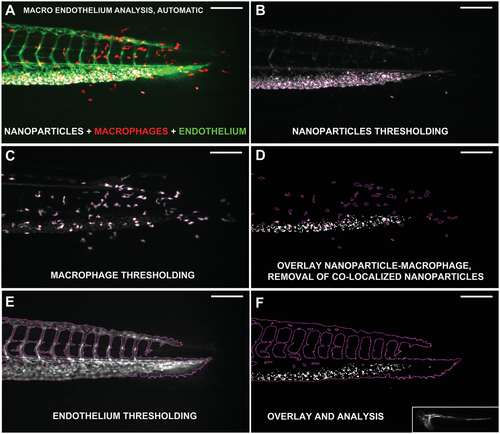
Endothelial uptake of NPs. Illustration of the steps undertaken by the endothelial analysis MACRO. A) Zebrafish embryos injected with 99 nm PEGylated liposomes with biotin (white) and fluorescent macrophages (red) as well as endothelium (green) are used for the analysis. B) NPs and C) macrophages are first thresholded. D) The NP signals in macrophages regions are deleted. Subsequently the signal of the endothelium is E) thresholded and F) overlapped to the residual NP measuring their fluorescence. The obtained values are normalized by the fluorescence of the whole zebrafish (panel (F), lower image). |