FIGURE SUMMARY
Title

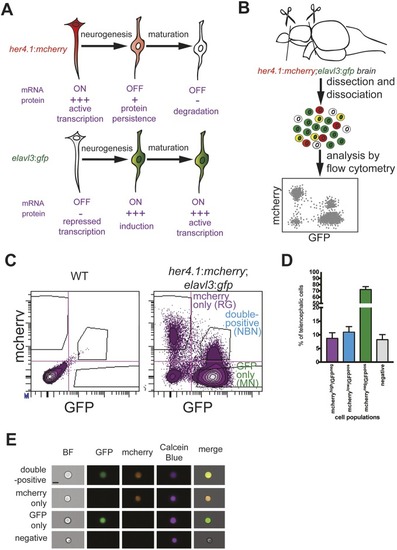
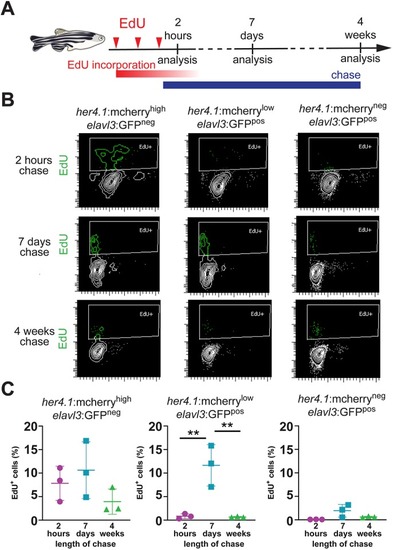
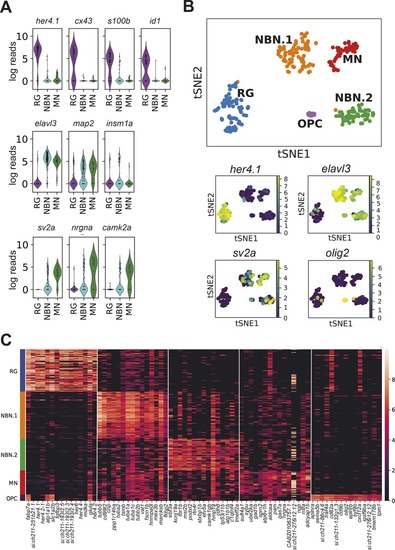
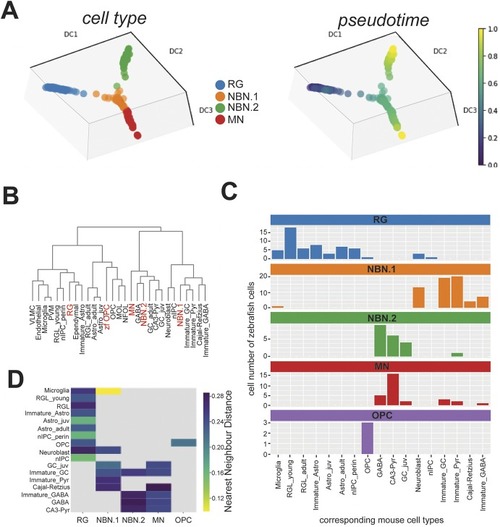
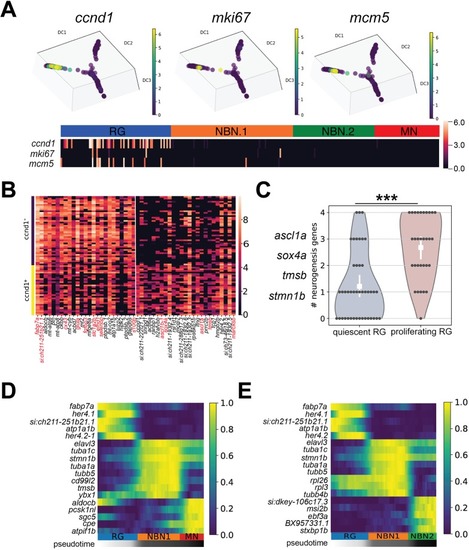
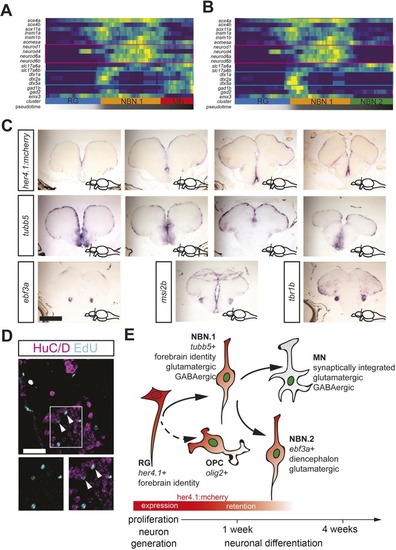
Single cell sequencing of radial glia progeny reveals diversity of newborn neurons in the adult zebrafish brain

Authors
Lange, C., Rost, F., Machate, A., Reinhardt, S., Lesche, M., Weber, A., Kuscha, V., Dahl, A., Rulands, S., Brand, M.
Source
Full text @ Development

A double-reporter line for identification and quantification of radial glia-derived newborn neurons in the adult zebrafish brain. (A) Model for the lineage-trace paradigm. NBNs stop to transcribe her4.1-driven mcherry, but inherit the protein from their RG precursors (top). At the same time, NBNs induce transcription of the neuronal marker elavl3:gfp (bottom), allowing the identification of NBNs as mCherry/GFP-double-positive cells in double reporter fish. (B) Scheme of the analytical workflow. Forebrains are removed from double reporter fish and dissociated, and cell types are analyzed by flow cytometry. (C) Representative FACS plots showing forebrain cells from wild-type (left) and her4.1:mcherry;elavl3:gfp double reporter fish (right). There are clearly separated populations of mCherryhigh/GFPneg RG and mCherrylow/GFPpos NBNs. (D) Quantification of cells in the four quadrants shown in C, revealing that NBNs can be found in a frequency comparable with RG and represent circa 10% of forebrain cells. n=5. Data are mean±s.e.m. (E) Representative single cells imaged in flow cytometry for mCherrypos/GFPpos (first row), mCherrypos/GFPneg (second row), mCherryneg/GFPpos (third row) and mCherryneg/GFPneg (fourth row). At least 20 cells were analyzed and no doublets were seen, excluding the double-positive cells that represent doublets. Scale bar: 7 µm.

Newborn neurons retain the radial glia-derived reporter signal transiently. (A) Scheme of experimental design, indicating the timing of EdU injections (red arrowheads), EdU incorporation (red bar), EdU chase (blue bar) and analysis timepoints after the last EdU injection. (B) Flow cytometry plots showing EdU (green) incorporation in sorted her4.1:mCherryhigh/elavl3:GFPneg cells (left), her4.1:mCherrylow/elavl3:GFPpos cells (middle) and her4.1:mCherryneg/elavl3:GFPpos cells (right) after 2 h (top), 7 days (middle) or 4 weeks (bottom) of chase. There is robust EdU labeling in her4.1:mCherrylow/elavl3:GFPpos after 7 days, but not after 2 h or 4 weeks chase. (C) Quantification of EdU labeling her4.1:mCherryhigh/elavl3:GFPneg cells (left), her4.1:mCherrylow/elavl3:GFPpos cells (middle) and her4.1:mCherryneg/elavl3:GFPpos cells (right) after 2 h (magenta), 7 days (blue) or 4 weeks (green). Single data points are shown; n=3; data are mean±s.e.m. **P<0.01 by one-way ANOVA and Bonferroni's post hoc test.

Single cell RNA-seq reveals the diversity of radial glia progeny in the adult forebrain. (A) Violin plots showing the expression of known radial glia markers (top), pan-neuronal markers (middle, elavl3 and map2), an early neurogenic fate marker (middle, insm1a) and markers of mature synaptically integrated neurons (bottom). (B) tSNE plot revealing five different clusters from a total of 264 RG, NBN and MN cells (top). The cell number per cluster is: RG, 76 cells; NBN.1, 80 cells; NBN.2, 54 cells; MN, 44 cells; and OPC, 10 cells. Smaller panels underneath show expression of characteristic marker genes that separate the different clusters. (C) Heat map with the top 15 cluster-specific genes for the five identified clusters.

The differentiation trajectory of zebrafish radial glia progeny clusters resembles mammalian adult neurogenesis. (A) Lineage trajectory analysis of single cell RNAseq data from RG, NBNs and MNs of the adult zebrafish forebrain. Color coding corresponds to the different cell clusters identified in Fig. 2B (left) or indicates the pseudotime progression (right). (B) Unbiased hierarchical clustering of transcriptome profile from zebrafish cell clusters (red) with cell types from the developing and adult murine hippocampus (black), showing dispersed co-distribution of zebrafish cell clusters with related mammalian cell types. (C) Quantification of distribution of zebrafish cell clusters over the different corresponding murine cell types for RG (blue), NBN.1 cells (orange), NBN.2 cells (green), MNs (red) and OPCs (purple). Bars specify the number of zebrafish cells (y-axis) corresponding to the indicated murine cell type (x-axis). (D) Heatmap depicting the similarity of zebrafish cell clusters with their corresponding murine cell types based on the k-nearest neighbor distance. Lower distances indicate higher similarities.

Proliferation is confined to radial glia and is associated with neurogenic commitment. (A) Expression pattern of the proliferation markers ccnd1 (left), mki67 (middle) and mcm5 (right) along the trajectory path of RG differentiation. A heatmap indicating the co-expression of these genes in RG is shown at the bottom. (B) Heatmap showing differentially expressed genes in ccnd1 quiescent RG and ccnd1+ proliferating RG. There is enrichment of classical RG markers in quiescent RG (left, red gene symbols), and of neurogenic fate determinants and NBN.1 marker genes in proliferating RG (right, red gene symbols). (C) Violin plot showing cumulative expression of the four most widely expressed neurogenic fate determinants and neuronal genes (left) in quiescent (gray) and proliferating (red) RG. Dots represent cells expressing the indicated number of genes. n=45 (quiescent) or 31 (proliferating). ***P<0.001 using a Mann-Whitney U-test. (D,E) Heatmaps showing gene expression dynamics of differentially expressed genes along the differentiation trajectory from RG to MNs (D) or from RG to NBN.2 cells (E). Genes (rows) are clustered and cells (columns) are ordered according to the pseudotime development. There is specific expression of tubb5 in the NBN.1 and of ebf3a and msi2b in the NBN.2 cluster.

The NBN clusters show diversity in cell fate determinant expression and anatomical localization in the adult forebrain. (A,B) Heatmaps showing gene expression dynamics of proliferation markers, Notch targets, neurogenic fate determinants, telencephalic identity markers and neuronal subtype markers along the differentiation trajectory from RG to MNs (A) or from RG to NBN.2 cells (B). Genes (rows) are clustered and cells (columns) are ordered according to the pseudotime development. Magenta and turquoise frames mark identity markers for dorsal or ventral telencephalon, respectively. (C) In situ hybridization for mcherry in her4.1:mcherry reporter fish (top), the NBN.1 marker tubb5 (middle), and the NBN.2 markers ebf3a, msi2b and tbr1b (bottom) in wild-type fish. There is consistent expression of NBN.2 markers in the lateral diencephalon. The rostrocaudal level of the section is indicated in the bottom right corner. (D) Optical section of immunostaining for the neuronal markers HuC/D (magenta) and EdU labeling (turquoise) in the vENT, indicating the localization of NBNs (arrowheads). (E) Schematic representation of the resulting model from this study. Scale bars: 200 µm in C; 20 µm in D.

Acknowledgments
This image is the copyrighted work of the attributed author or publisher, and ZFIN has permission only to display this image to its users. Additional permissions should be obtained from the applicable author or publisher of the image. Full text @ Development