FIGURE SUMMARY
Title

Phytochemicals inhibit migration of triple negative breast cancer cells by targeting kinase signaling

Authors
Shahi Thakuri, P., Gupta, M., Singh, S., Joshi, R., Glasgow, E., Lekan, A., Agarwal, S., Luker, G.D., Tavana, H.
Source
Full text @ BMC Cancer

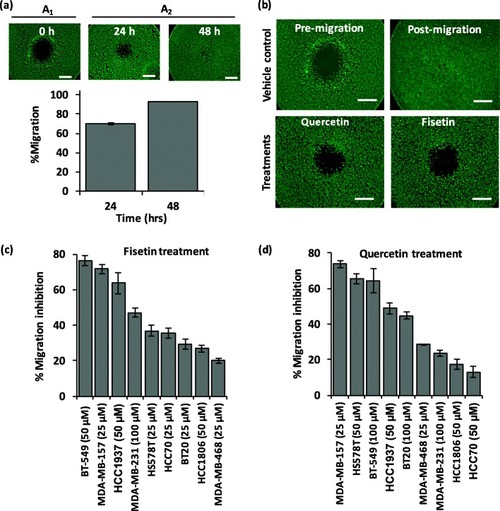
Phytochemicals inhibit migration of TNBC cells. a A micropatterned circular gap within a layer of BT-549 TNBC cells before migration (left, A1), after 24 h (middle, A2), and after 48 h (right, A2) of migration. Bar graph in (a) shows percent migration, i.e., 1-(A2/A1), of BT-549 cells for two different time points. Each bar represents the mean of 8 replicates and each error bar represents standard error from the mean. Scale bar in (a) is 1 mm. b Representative images of migration inhibition of BT-549 cells with fisetin and quercetin treatments compared to non-treated cells. Scale bar in (b) is 1 mm. Inhibition of migration of nine TNBC cell lines by (c) fisetin and (d) quercetin. Each bar represents the mean of 8 replicates and error bars are standard error from the mean. Concentrations shown on the x-axis are threshold concentrations of the compounds to maintain a viability of over 90% for each cell line

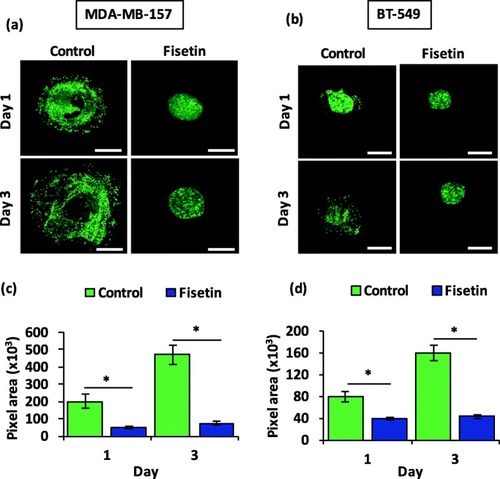
Fisetin inhibits collagen invasion of TNBC cells. Z-projected images of spheroids of (a) MDA-MB-157 and (b) BT-549 cells in collagen hydrogel without and with 100 μM fisetin treatment for 24 and 72 h. Scale bar is 300 μm. Total pixels area occupied by (c) MDA- MB-157 and (d) BT-549 cells in the collagen matrix. *p < 0.001

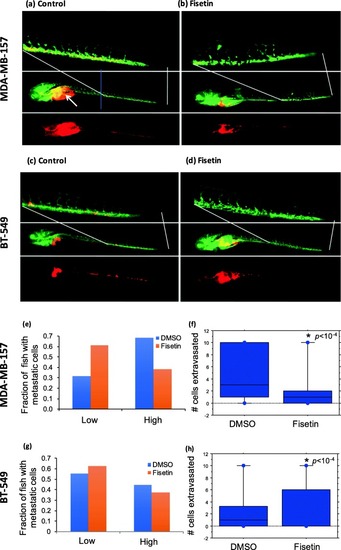
Fisetin treatment reduces TNBC metastasis in vivo. MDA-MB-157 and BT-549 cells were injected into two-day post-fertilization zebrafish embryos. Fish were treated either with 0.5% DMSO or with 100 μM Fisetin. Cells were allowed to migrate to the tail for 4 days. a, c Representative images of DMSO-treated fish with intravasated cells in to the tail. Green shows fish vasculature and red represents cancer cells. b, d Representative images of fisetin-treated fish. e, g Fish with less than two cells in the tail were grouped as low and fish equal to or more than two cells in the tail were grouped as high. f, h Box plots of extravasated cells in vehicle control compared to the treated groups. Note that in fisetin-treated fish with BT-549 cells, the median is at zero. A blue line in the middle panel of (a) indicates the cut-point for separating the tail from the rest of the fish. A white arrow in the same panel indicates the site of injection for tumor cells in the yolk sac. Top panels are high-resolution images for tails to highlight the migrated tumor cells in the tail region. Bottom panel shows the location of tumor cells (red) in the fish

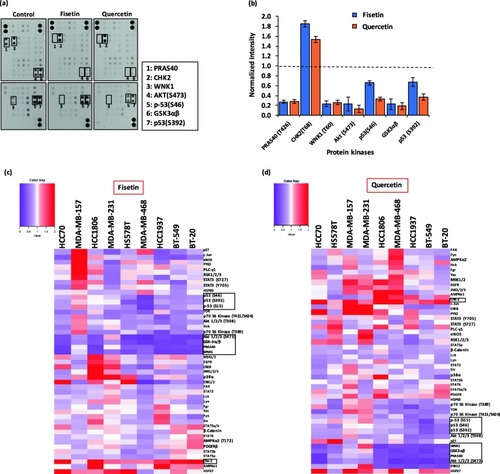
Molecular effects of phytochemicals on TNBC cells. a Representative human phospho-kinase blot array of BT-549 cells under no treatment (left), fisetin treatment (middle), and quercetin treatment (right). The kinases boxed and numbered in the blots represent major signaling protein targets of the phytochemicals. b Quantified normalized dot blot intensity of multiple kinases from fisetin and quercetin treatments of BT-549 cells. Error bars represent standard error from the mean (n = 2). Heatmaps of normalized phosphorylated levels of 43 protein kinases and 2 related proteins in nine TNBC cell lines treated with (c) 200 μM fisetin and (d) 200 μM quercetin. Phosphorylated level of each protein from a treated group was normalized by that from the corresponding vehicle control group to generate the heatmaps. Signaling molecules highlighted in boxes showed significant changes in phosphorylation by fisetin and quercetin treatments

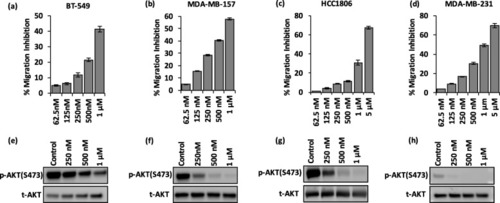
GSK1059615 dose-dependently inhibits migration of TNBC cells. a-d Migration inhibition of TNBC cells after 48 h treatment with GSK1059615. Maximum concentration used for each cell line was limited by toxicity. e-h Western blots of p-AKT and t-AKT for TNBC cells under GSK1059615 treatment. Note that the y-axis scale is different in panels (a-d)

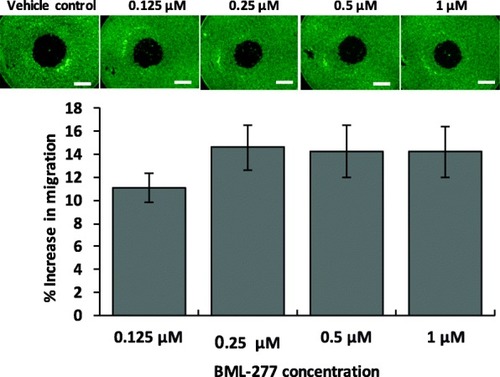
Inhibition of checkpoint kinase 2 (CHK2) promotes migration of TNBC cells. Dose-depending inhibition of CHK2 using BML-277 increases migration of MDA-MB-231 cells. Each bar represents a mean of 8 samples and error bars represent standard error from the mean. Scale bar is 1 mm

Acknowledgments
This image is the copyrighted work of the attributed author or publisher, and ZFIN has permission only to display this image to its users. Additional permissions should be obtained from the applicable author or publisher of the image. Full text @ BMC Cancer