
- Title
-
Probabilistic Models of Larval Zebrafish Behavior Reveal Structure on Many Scales
- Authors
- Johnson, R.E., Linderman, S., Panier, T., Wee, C.L., Song, E., Herrera, K.J., Miller, A., Engert, F.
- Source
- Full text @ Curr. Biol.
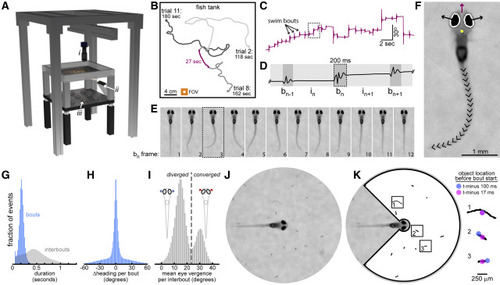
Acquiring Behavioral Data with BEAST (A) BEAST schematic. Infrared camera (i) moves on motorized gantry to stay above fish. Frame rate = 60 fps. Projector (ii) and IR-LEDs (iii) illuminate screen embedded in tank bottom. See Video S1 for animated schematic. (B) Swim paths from three trials from one fish. Arena water volume = 300 × 300 × 4 mm. Camera field of view = 22 × 22 mm (orange square). (C) Fish heading direction over time (from purple section in B). (D) Expansion of box from (C) with bout and interbout epochs identified (notation indicated). (E) One swim bout (from box in D) after image registration. (F) Head position (yellow dot), heading direction (purple arrow), eye vergence angles (angles of black arrows above horizontal), and tail shape (20 tail tangent directions) extracted in every frame (frame 3 from E shown). See Figure S1 for details. (G) Histograms of all bout and interbout durations. (H) Histogram of heading direction change per bout (heading). (I) Histogram of mean eye vergence per interbout. Convergence threshold set at local minimum: 24°. (J) Video dataset cropped to circular FOV (diameter = 8.12 mm). (K) Locations, sizes, shapes, and relative velocities of putative prey are identified preceding initiation of every swim bout (here shown for objects in J). Box width = 820 μm. Identified objects are mostly edible (paramecia, rotifers), but include also algae, dust (box 1), and artifacts. |
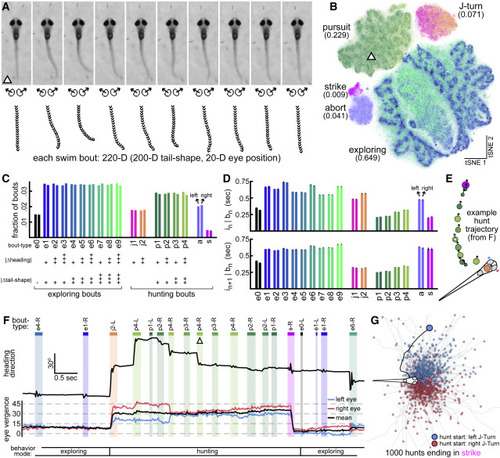
Exploring and Hunting Bout-Type Categorization (A) Bouts are represented as 10-frame postural sequences beginning at bout initiation. Bout shown immediately follows image from Figure 1J. (B) Bout dataset embedded in 2D space with tSNE. Five bout classes (abundances in parentheses) identified with density-based clustering (Figure S2). Location of bout from (A) indicated with triangle. Each bout is a point, colored by bout type (see C for colormap). (C) Large bout classes are subdivided to get bout types. Plus signs indicate kinematic parameter magnitude. (D) Duration (mean ± SE) of interbout intervals preceding (top) and following (bottom) left and right versions of each bout type. (E) Trajectory of 13-bout hunt ending in strike. Circle locations and arrows indicate head position and heading direction preceding bout initiation. Circle colors indicate bout type. Circle areas are proportional to tail shape. (F) Hunt from (E) contained in a longer bout sequence. Heading direction and eye vergence angles shown over time with bout and interbout epochs indicated. Bout from (A) indicated (triangle). See Video S2 for corresponding video data. (G) Trajectories from 1,000 complete hunts ending in strike (black line, hunt from E). |