
- Title
-
Acute Exposure to Permethrin Modulates Behavioral Functions, Redox, and Bioenergetics Parameters and Induces DNA Damage and Cell Death in Larval Zebrafish
- Authors
- Nunes, M.E.M., Schimith, L.E., da Costa-Silva, D.G., Lopes, A.R., Leandro, L.P., Martins, I.K., de Mello, R.S., Hartmann, D.D., de Carvalho, N.R., da Rosa, P.C., Trevisan, R., Di Giulio, R.T., Posser, T., Franco, J.L.
- Source
- Full text @ Oxid Med Cell Longev
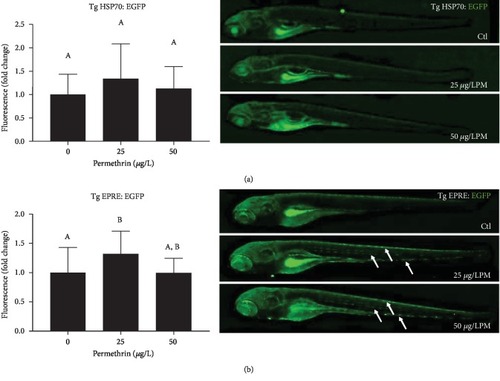
Effects of permethrin exposure (25 and 50 |
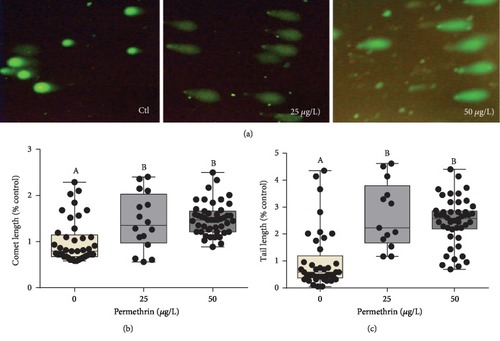
Exposure to permethrin (25 and 50 |
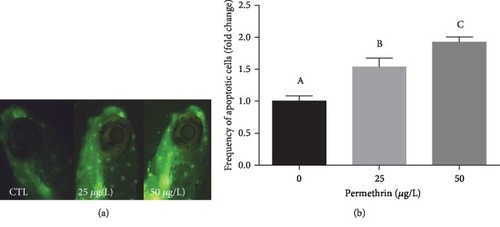
Exposure to permethrin (25 and 50 |