
- Title
-
The Responses of Germ-Free Zebrafish (Danio rerio) to Varying Bacterial Concentrations, Colonization Time Points, and Exposure Duration
- Authors
- Tan, F., Limbu, S.M., Qian, Y., Qiao, F., Du, Z.Y., Zhang, M.
- Source
- Full text @ Front Microbiol
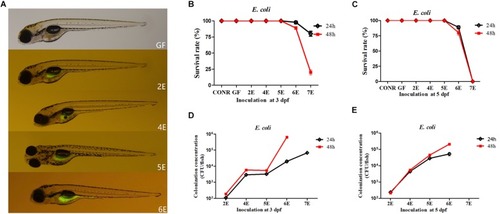
Germ-free zebrafish colonized with GFP labeled |
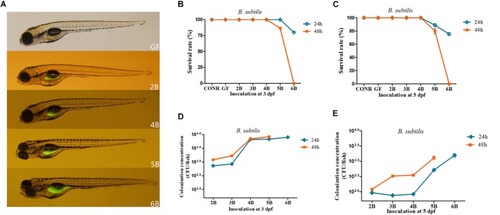
Germ-free zebrafish colonized with GFP labeled |
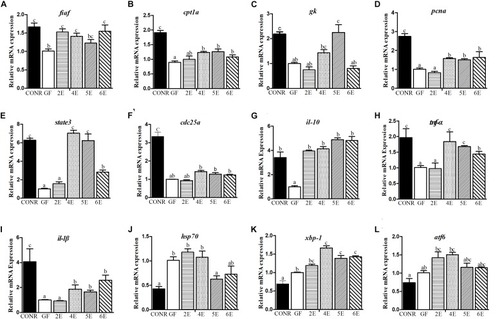
Comparisons of gene expression levels among germ-free (GF) zebrafish, CONR zebrafish and mono-associated (GF) zebrafish with different concentrations of |
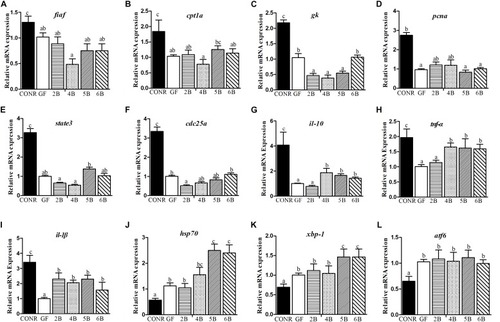
Comparisons of gene expression levels among germ-free (GF) zebrafish, CONR zebrafish and mono-associated (GF) zebrafish with different concentrations of |
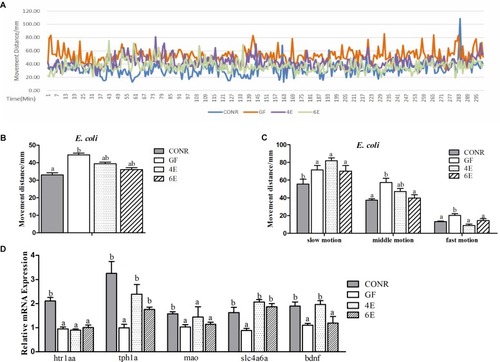
Behavior detection of CONR larvae, germ-free (GF) larvae and germ-free larvae mono-associated with 104 and 106 CFU/ml |
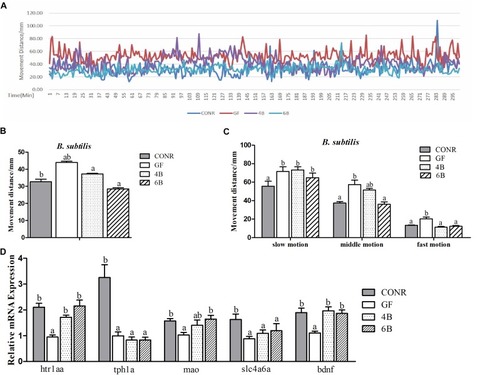
Behavior detection of CONR larvae, germ-free (GF) larvae and germ-free (GF) larvae mono-associated with 104 and 106CFU/ml |